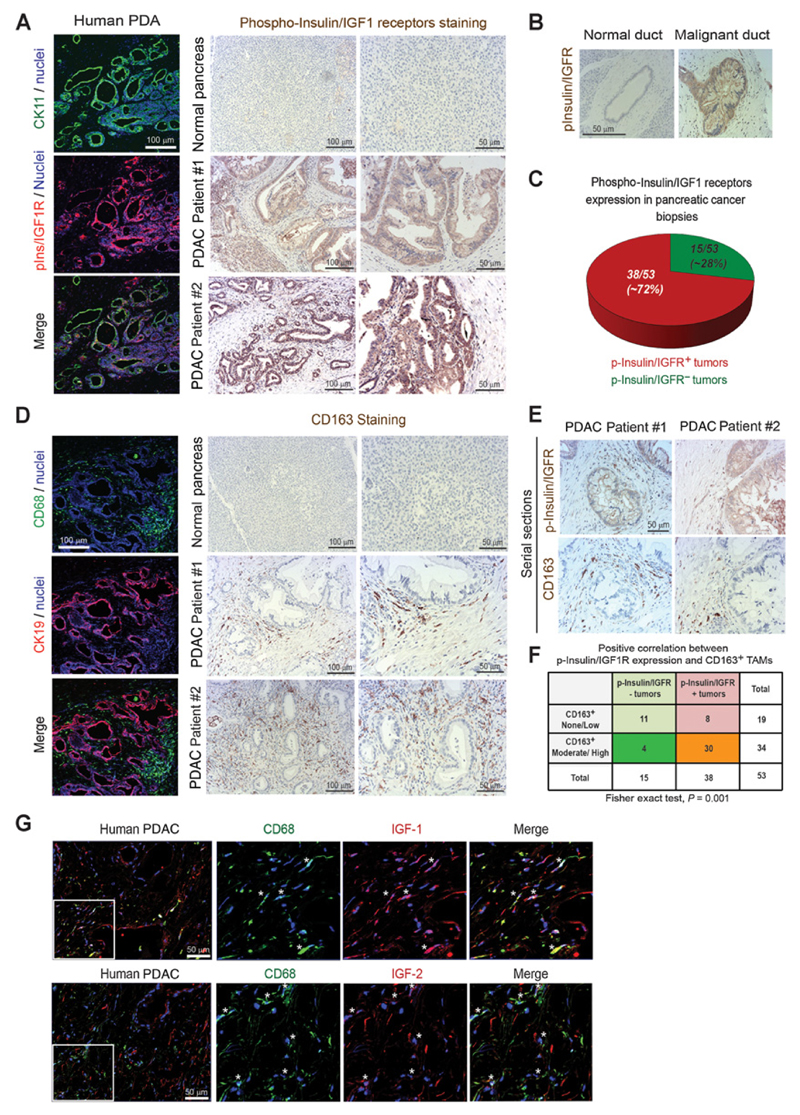
Figure 3. Insulin and IGF1 receptors are activated on cancer cells in biopsies from patients with PDAC, and this correlates with increased numbers of TAMs.
A, Left, confocal microscopy images of frozen human PDAC tissues immunofluorescently costained for the tumor epithelial marker CK11 (green), phospho-insulin/IGF1 receptors (red), and nuclei (blue). Scale bar, 100 μm. Right, immunohistochemical staining of phospho-insulin/IGF1 receptors in normal human pancreas and biopsies from patients with PDAC. Scale bars, 100 μm and 50 μm. B, Images of normal and malignant human pancreatic ducts immunohistochemically stained for phospho-insulin/IGF1 receptors. Scale bar, 50 μm. C, Pie diagram representing the percentage of phospho-insulin/IGF1 receptor–positive (red) and negative (green) tumors assessed in tissue microarrays containing biopsies from 53 consented PDAC patients. D, Left, confocal microscopy images of frozen human PDAC tissues immunofluorescently costained for CD68 (green), CK19 (red), and nuclei (blue). Scale bar, 100 μm. Right, immunohistochemical staining of CD163 in normal human pancreas and biopsies from patients with PDAC. Scale bars, 100 μm and 50 μm. E, Serial sections of biopsies from human PDAC samples immunohistochemically stained for phospho-insulin/IGF1 receptors and CD163. Scale bar, 50 μm. F, Contingency table and results from statistical analysis showing a strong evidence of positive correlation between phospho-insulin/IGF1R expression in tumors and increased CD163+ macrophage infiltration. Relative risk = 4.92 [95% confidence interval (CI), 1.82–13.34], P = 0.001 using Fisher exact test. G, Immunofluorescent images of human PDAC tissues stained for CD68 (green), IGF1 or IGF2 (red) and nuclei (blue). White stars, CD68+ macrophages that express IGF1 or IGF2. Scale bar, 50 μm.

