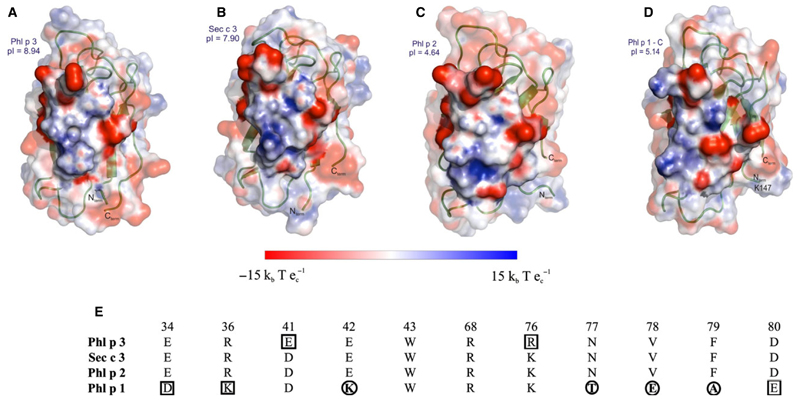
Figure 4.
Electrostatic surface potential of the experimental epitope. Electrostatic charge distribution (units ± 15 kbTec−1; kb, Boltzmann’s constant; T, temperature in K; ec, charge of an electron) was calculated for the structures and mapped onto the surface representing the experimental epitope derived from Phl p 2–IgE complex. The experimental epitope area is shown as nontransparent surface while the rest of the surface has a transparency level of 0.5, partly covering the cartoon representation of the proteins. (A) Phl p 3 structure (this work), (B) Sec c 3 model (generated by Modeller based on Phl p 3 structure), (C) Phl p 2 (protein data bank, PDB: 1WHO), (D) the C–terminal domain of Phl p 1 (PDB: 1N10). All structures are oriented according to A. (E) Residues involved in the experimental Phl p 2–IgE epitope by direct contacts (H – bonds and van der Waals contacts) and the equivalent residues in the Phl p 3, Sec c 3 and Phl p 1 structures are listed and numbered according to the Phl p 3 sequence. Differences in the mapped epitope regions are highlighted; conservative changes are boxed and nonconservative changes are circled.

