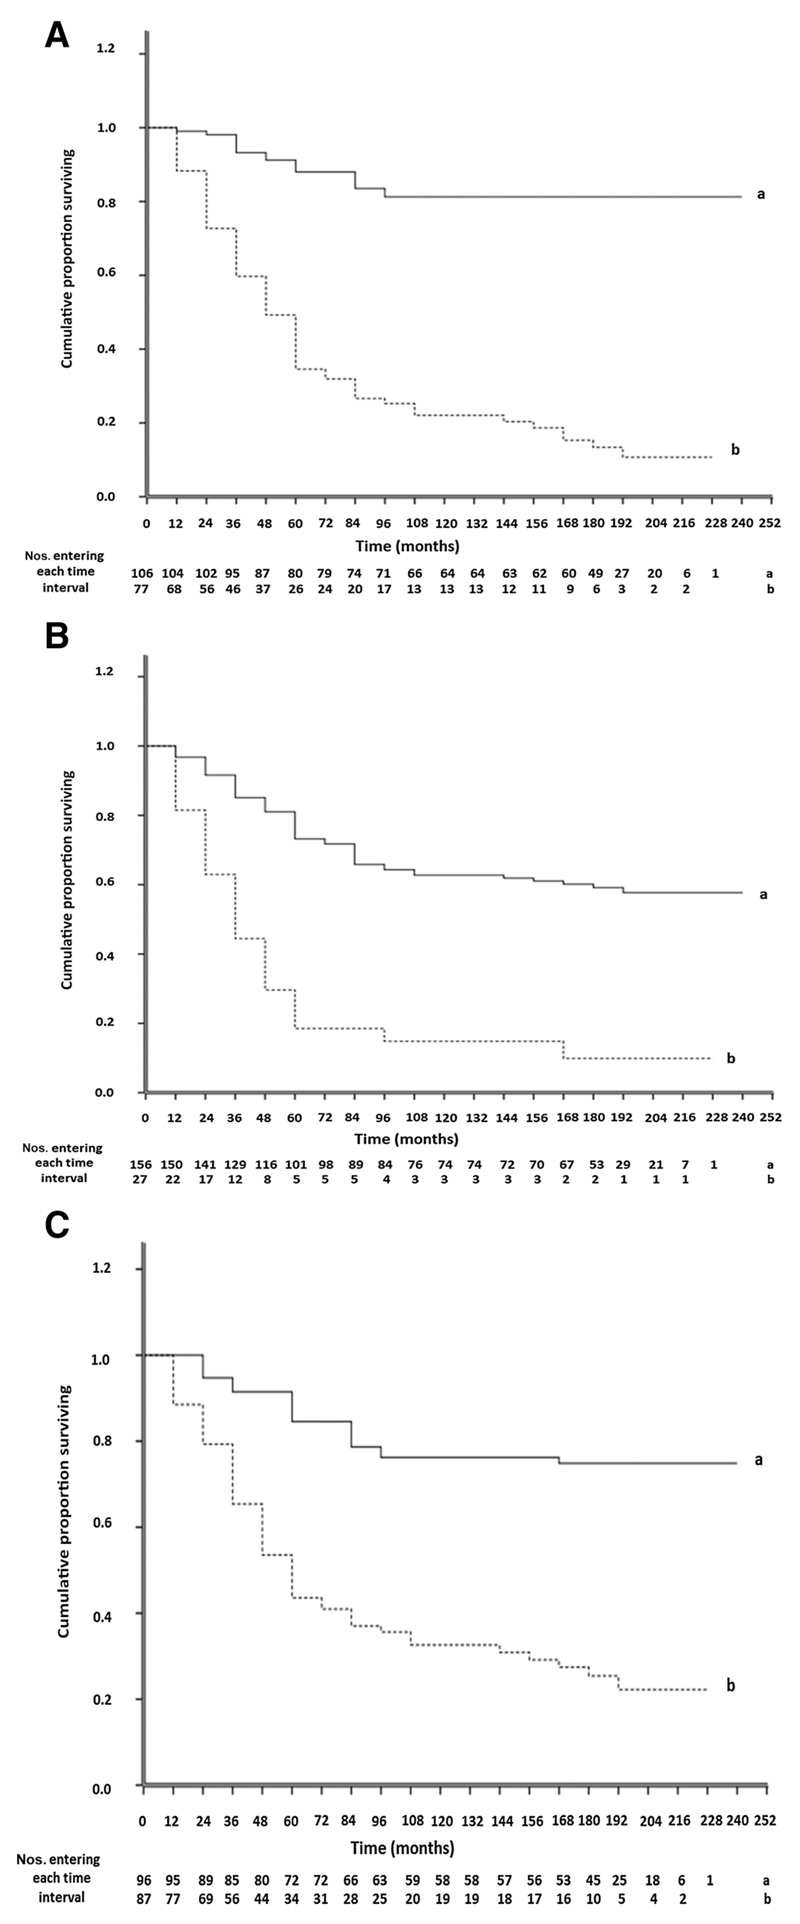
Figure 5.
Association of immunohistochemical staining for MMPs with overall time of patient survival. Cumulative proportion of surviving patients as a fraction of the total for each year after presentation for patients with carcinomas classified as negatively-stained (set a, solid line) or positively-stained (set b, dotted line) is shown for MMP2 (A), MMP9 (B), and MMP13 (C). Numbers of patients entering each year are shown below. The two curves are highly significantly different in each case (Wilcoxon statistic χ2 = 71.81, 32.50, or 41.90 for A, B, or C, respectively, 1 df, P < 0.001). Further details are shown in Supplementary Materials.

