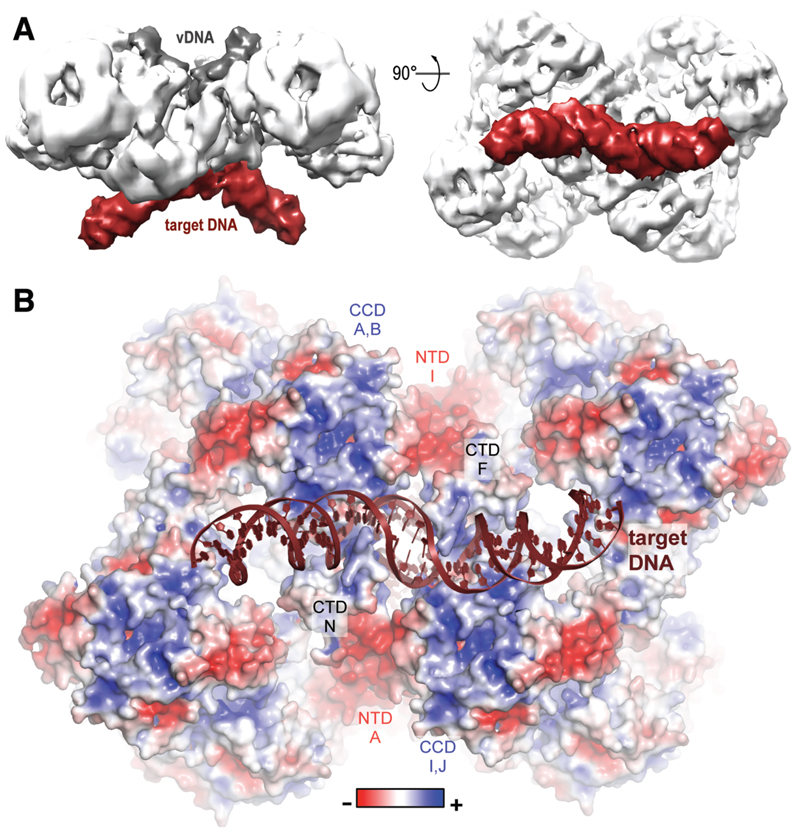
Fig. 3. Target DNA binding and surface electrostatic potential distribution.
A. Cryo-EM reconstruction of the MVV strand transfer complex at 8.6 Å resolution viewed in two orientations. Protein, vDNA, and target DNA are shown in white, dark grey and bordeaux, respectively. B. Pseudo-atomic model of the STC with the protein portion of the structure in space-fill mode and colored by charge.

