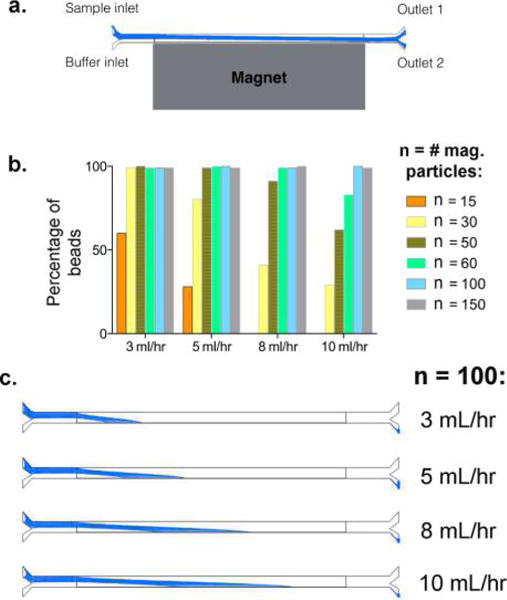
Figure 3.

Magnetophoresis simulation of the microfluidic device. (a) Schematic of the system in our simulation analysis. The trajectories of the magnetized positive population are highlighted in blue. (b) Graph depicting the percentage of positive beads (associated with different numbers of magnetic particles) isolated at outlet 2 under varying flow rates. The flow rate value indicates the flow speed at each inlet. (c) The trajectories of a positive bead bound to 100 magnetic particles (representing a typical positive hit in a library screen) within the fluidic channel under varying flow rates, showing the potential of this device to consistently and accurately sort positive hits even under a high flow rate of 10 mL/h.
