
Figure 2.
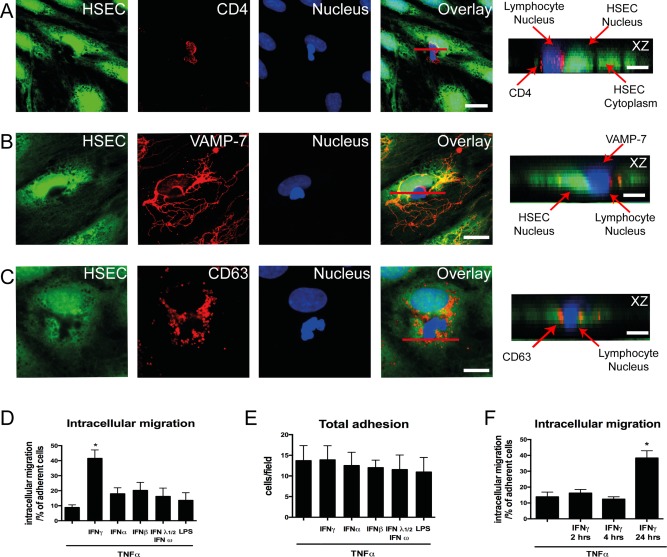
Intracellular migration of lymphocytes into primary HSECs. (A) Representative confocal images of lymphocytes adherent to cytokine‐treated HSEC monolayer. HSEC cytoplasm was stained with CellTracker CMFDA (green), lymphocyte membrane was stained with CD4 marker (red), and HSEC and lymphocyte nuclei were stained with DAPI (blue). (B) Immunofluorescent staining for lysosomal markers VAMP‐7 (red) and (C) CD63 (red) were performed. Orthogonal (XZ) projections are shown corresponding to the plane of the red line in the overlay images. Arrows in the orthogonal projections indicate the HSEC/lymphocyte nucleus and its relationship to the lysosomal compartment. (D) Quantification of intracellular migration. (E) Adhesion of peripheral blood lymphocytes on cytokine‐treated HSECs. (F) Quantification of intracellular migration on TNFα‐ and IFNγ‐treated HSECs at various time points. Quantitative data are the mean ± SEM of three independent experiments. Statistical significance was determined using one‐way analysis of variance, with a Tukey's post hoc multiple comparison test. *P < 0.05. Scale bars = 20 μm (A), 10 μm (B,C), and 5 μm (A‐C, orthogonal projections).