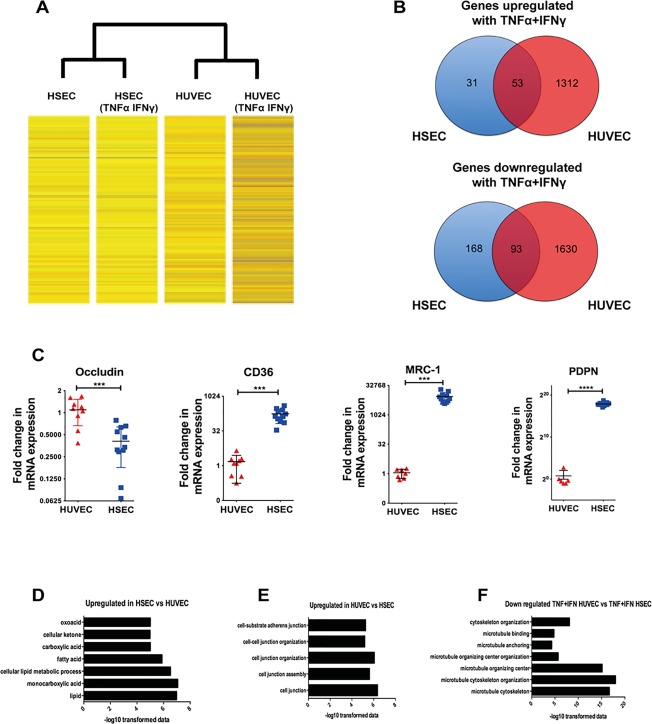
Figure 8.

Microarray demonstrates differential gene expression changes between HSECs and HUVECs in response to TNFα and IFNγ challenge. (A) Heat map images of gene expression changes. Unstimulated HSECs and HUVECs were compared with HSECs and HUVECs that had been stimulated with TNFα and IFNγ (10 ng/mL) for 24 hours. (B) Summary of the total number of mutual and exclusively up‐regulated and down‐regulated genes after cytokine stimulation in HSECs and HUVECs. Genes were identified to be up‐regulated or down‐regulated based on log ratios that were 2‐fold or greater. (C) Comparative messenger RNA expression between HUVECs and HSECs of occludin, CD36, macrophage mannose receptor (MRC‐1), and podoplanin (PDPN). (D,E) Pathway analysis of up‐regulated and down‐regulated genes in unstimulated HSECs compared with HUVECs. (F) Pathway analysis of down‐regulated genes in stimulated HUVECs compared with stimulated HSECs. The pathways are plotted against their corresponding −log10 values of probability on the x axis. Statistical significance was determined using a two‐tailed t test. ***P < 0.001. ****P < 0.0005.
