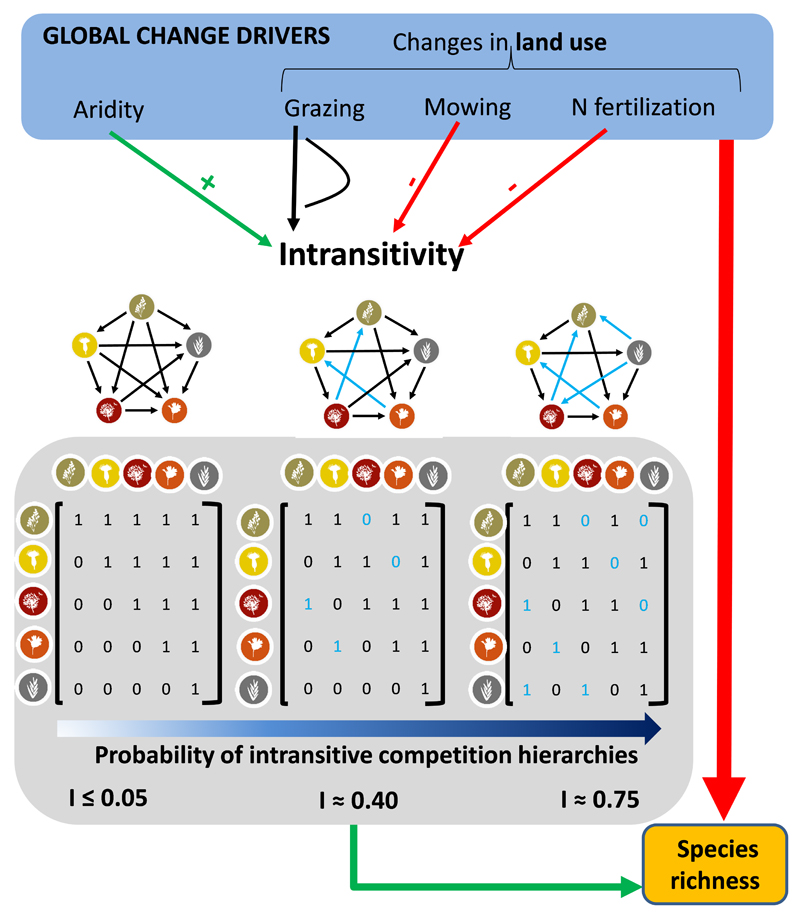
Figure 1.
Conceptual model outlining our theoretical framework. We address here the direct and indirect relationships between 1) global change drivers (GCDs), 2) intransitive competition networks and 3) species richness. Intransitivity is expected to increase richness. GCDs are expected to decrease species richness and have variable effects (positive = green, negative = red, unimodal = black) on intransitivity. Species-by-species transition matrices with different levels of intransitivity are shown. These matrices have an associated competition network (arrow pointing from winner to loser) and their changes in abundance across time or space (represented in different columns within the grid boxes). Competitive reversals from perfect hierarchical competition are in blue (numbers and arrows) and the changes expected in our intransitivity metric (I) are shown.

