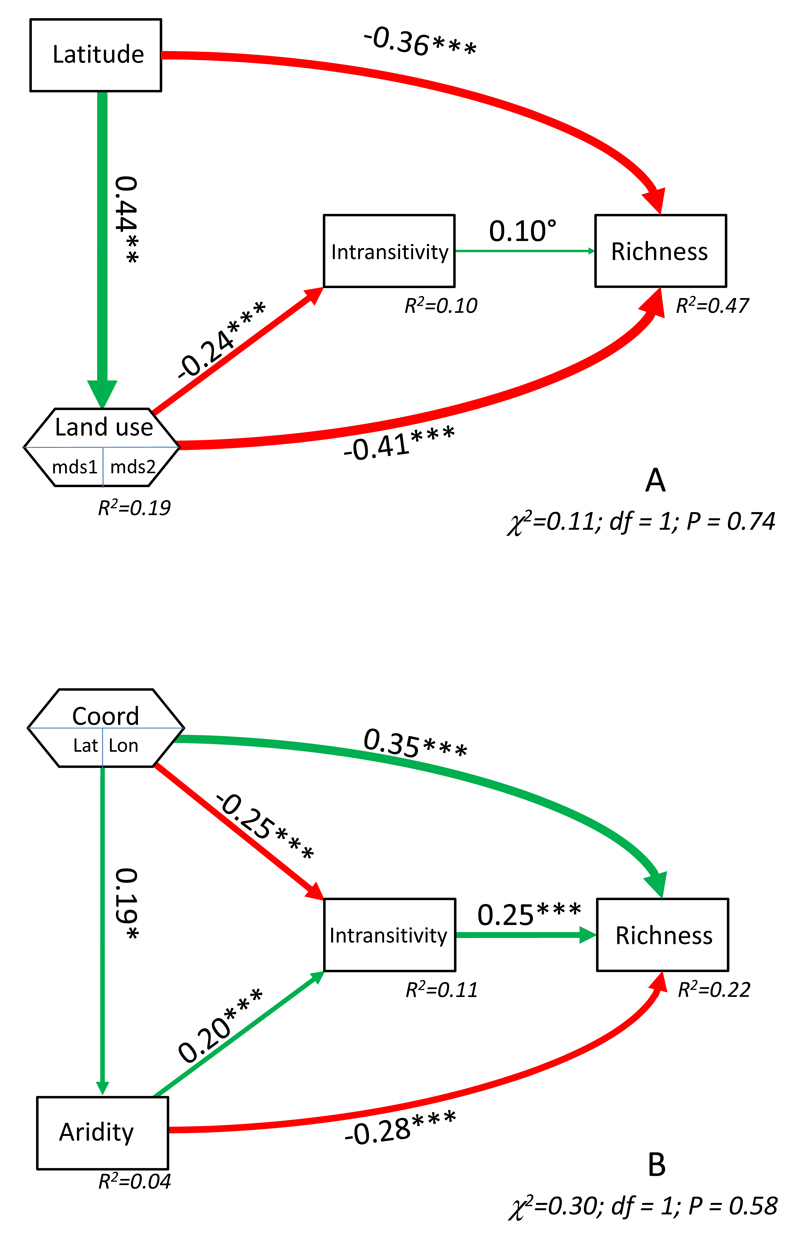
Figure 4.
Structural equation models depicting effects of geographic factors (region or latitude/longitude) and global change drivers (land-use or aridity) on intransitivity and species richness for grasslands (A) and drylands (B). Composite variables are shown with the variables forming them inside. The width of arrows is proportional to the standardized path coefficient, with green and red lines for positive and negative relationships, respectively. The overall goodness-of-fit test and the R2 for each variable introduced are given. P-values are: *** = P < 0.001; ** = P < 0.01; * = P < 0.05; º = P < 0.1. Lat = latitude, lon = longitude, mds= non-metric multi-dimensional ordination axes performed with the land-use variables.

