Figure 1.
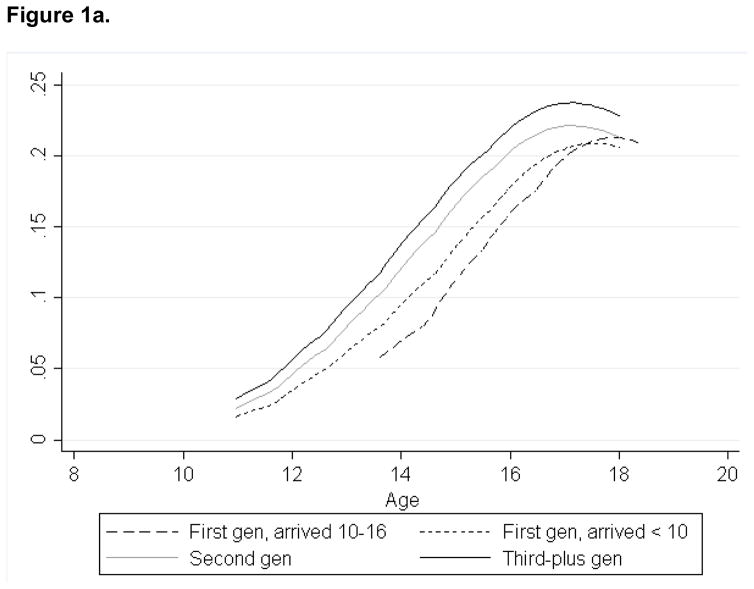
Figure 1a. Hazard estimates of first sex over exposure period, young women, by immigrant generation and age at migration
Source: 1997 National Longitudinal Survey of Youth, 1997–2010.
Notes: The smoothed hazards are adjusted near the boundaries, and the plotted range of the smoothed hazard function is restricted to within one bandwidth of each endpoint. To fully capture the boundaries of our exposure period, we included in the hazard estimates an exposure period ranging from ages 8–20.
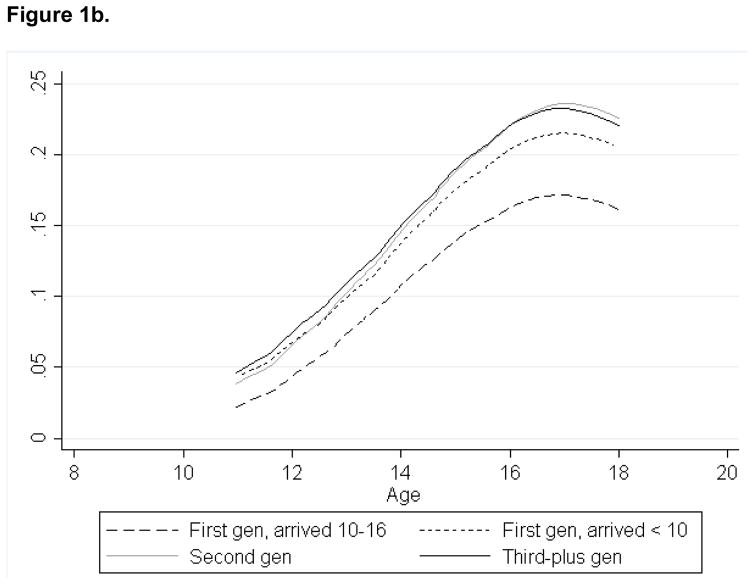
Figure 1b. Hazard estimates of first sex over exposure period, young men, by immigrant generation and age at migration
Source: 1997 National Longitudinal Survey of Youth, 1997–2010.
Notes: The smoothed hazards are adjusted near the boundaries, and the plotted range of the smoothed hazard function is restricted to within one bandwidth of each endpoint. To fully capture the boundaries of our exposure period, we included in the hazard estimates an exposure period ranging from ages 8–20.


