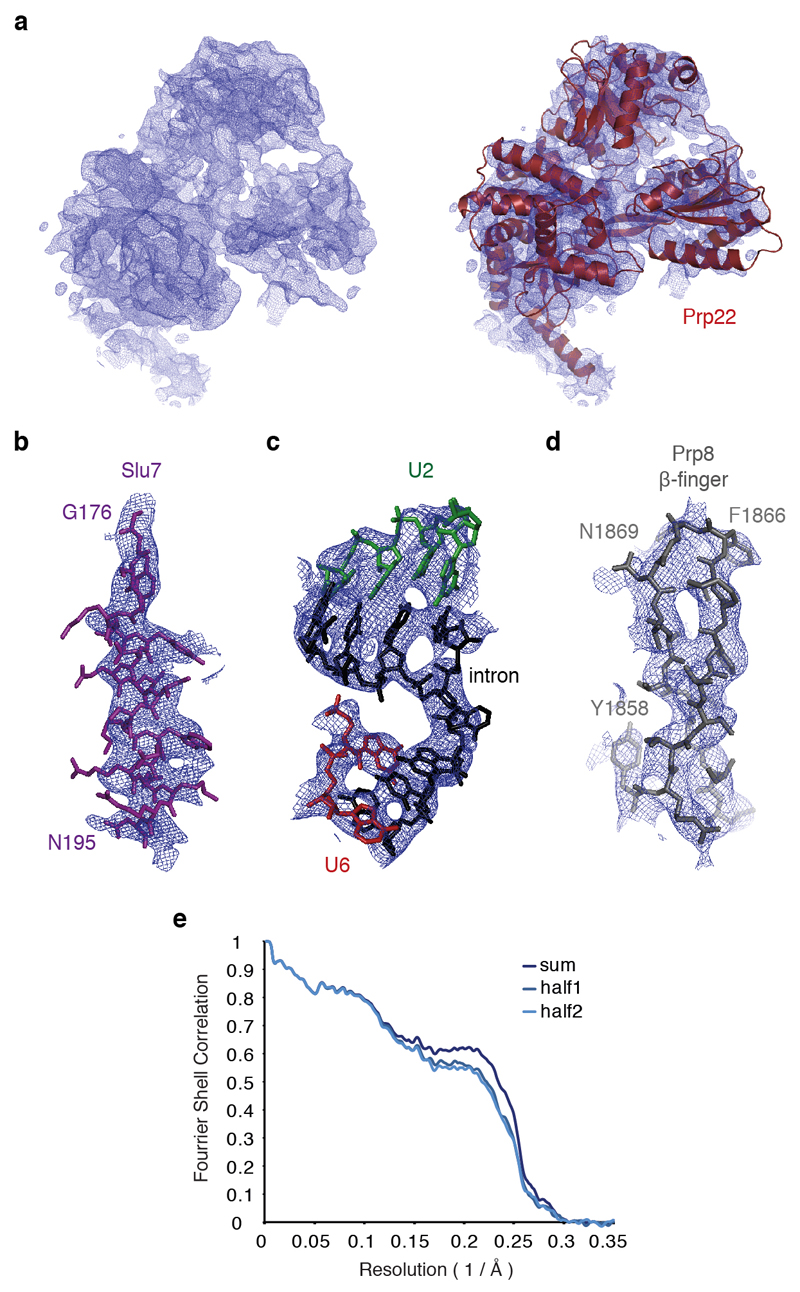
Extended Data Figure 4. Fit of the model built into the C* map.
a, Experimental density for Prp22 and fitting of the model into the density. b-d, Fitting of the model into the experimental density for key regions of the C* map. e, Fourier Shell Correlation between model and the map and cross-validation of the model fitting. The original atom positions have been randomly displaced up to 0.5 Å and refined with restraints against the half1 map only. FSC was calculated for the two half maps. Excellent correlation up to the high resolution between the model and the half2 map (which was not used in refinement) cross-validates the model for overfitting.

