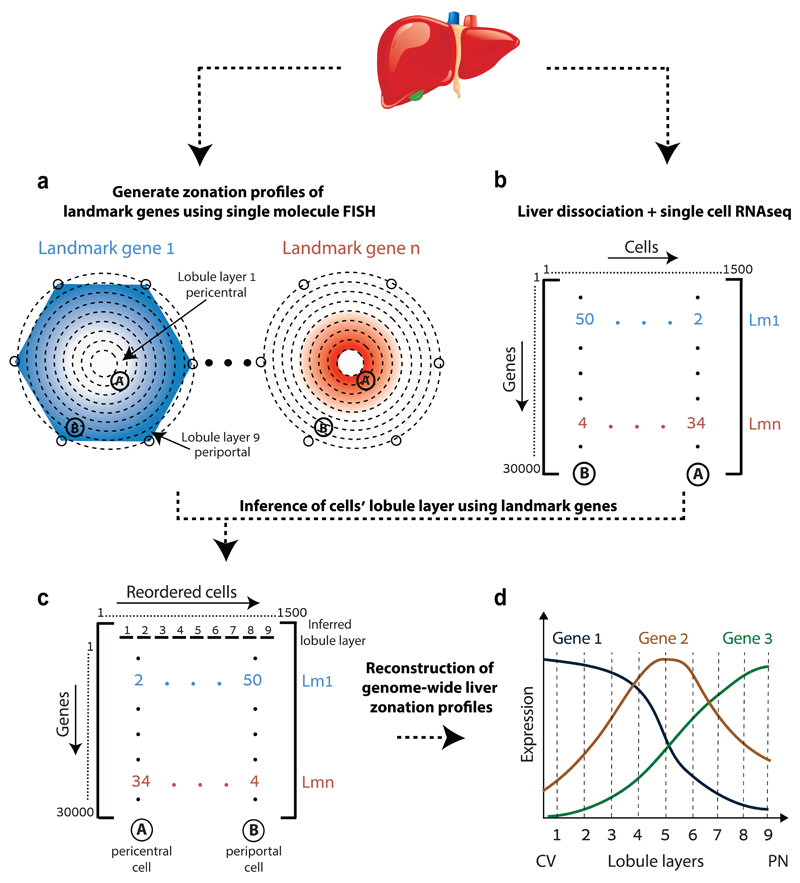
Fig. 1. Strategy for spatially resolved single-cell reconstruction of liver zonation.
(a) Spatial barcode of zonated landmark (Lm) genes measured with smFISH. (b) scRNAseq provides the transcriptome of thousands of mouse liver cells. (c) Spatial barcode is used to infer the porto-central coordinates of each cell. For example, cell B, containing 50 UMI of the blue Lm1, and 4 UMI of the red Lmn is inferred to have resided in the outer periportal layers. Cell A, with 2 UMI of Lm1 and 34 UMI of Lmn is inferred to have resided in the inner pericentral layers. (d) These coordinates are used to reconstruct the spatial zonation profiles of all liver genes.

