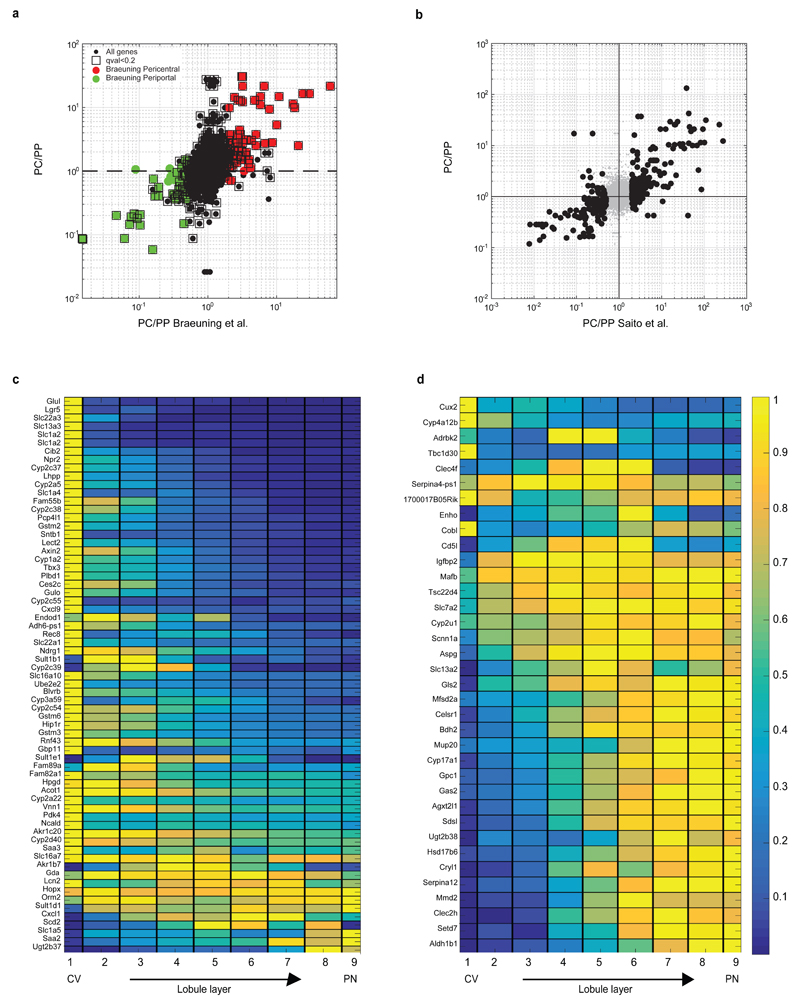
Extended Data Figure 7. Porto-central ratio of reconstructed zonation profiles correlates with previous studies.
(a) Correlation between the pericentral bias computed from our data and the one from Braeuning et al.9. Y axis is our pericentral bias (PC/PP), computed as the ratio between the median zonation profiles in layers 1-4 and the median in layers 6-9. X-axis is the ratio between expression in pericentrally and periportally enriched genes from9. 79 of the 88 genes considered pericentral according to Braeuning et al. (red circles) are also pericentrally biased in our dataset (hypergeometric p<4E-9). 70 of the 81 genes considered periportal according to Braeuning et al. (green circles) are also periportally biased in our dataset (hypergeomtric p<1E-16). Black squares mark genes that we found to be significantly zonated. (b) Pericentral bias computed by our method correlates with previous bulk RNAseq studies that compared pericentral and periportal populations isolated via laser capture microdissection10. RSpearman=0.74, p<E-80. Black dots represent genes considered significantly zonated Data in10. (a-b) include genes with average expression across cells which is higher than 5E-6 of the total UMI counts. (c) Reconstructed zonation profiles for the genes found in Wang et al.2 to have higher expression in Axin2+ pericentral hepatocytes (qval<0.2). (d) Reconstructed zonation profiles for the genes found in Wang et al. to have lower expression in pericentral Axin2+ hepatocytes (qval<0.2).

