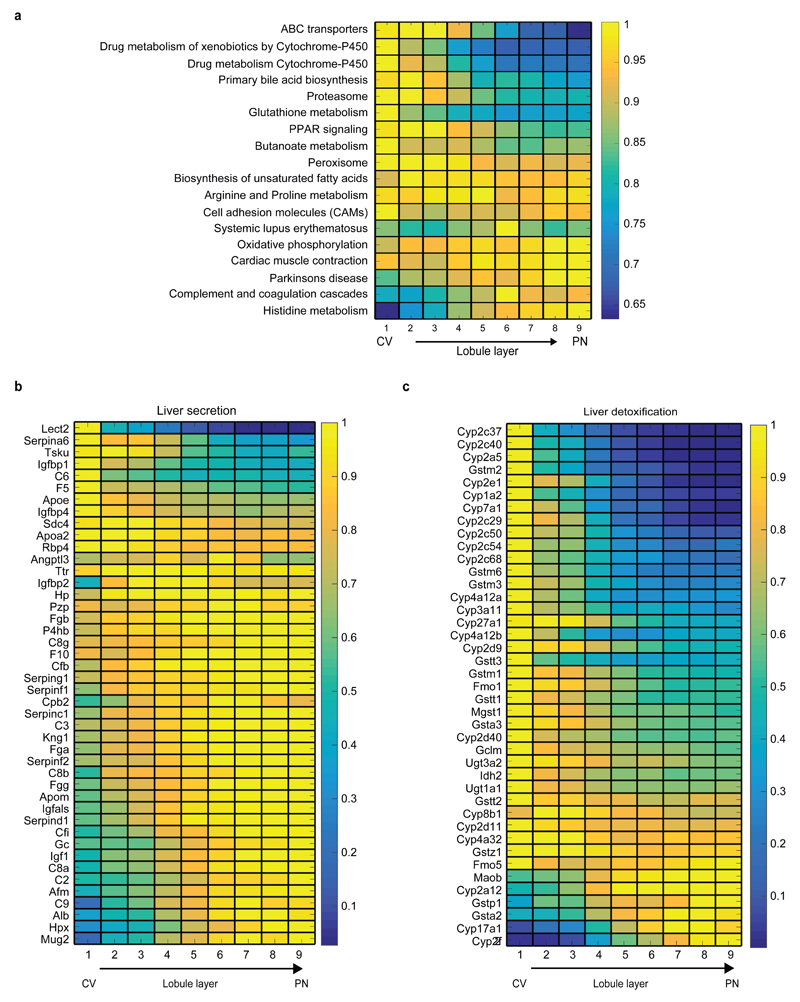
Extended Data Figure 9. KEGG pathways enriched for zonated genes.
(a) Average max-normalized zonation profiles of KEGG pathways enriched for zonated genes. Panel displays all pathways with more than 10 genes and hypergeometric q-value<0.1 (Table S5 exhibits full results). Each profile was normalized by its maximum along all layers. (b) Periportal bias of liver secreted proteins. Genes are based on an annotated liver secretome37. (c) Pericentral bias for liver detoxification genes. Shown are genes for cytochrome P450, Uridine 5'-diphospho-glucuronosyltransferase and glutathione S transferase. Images in (b-c) include significantly zonated genes from each pathway (Kruskal-Wallis qval<0.01 and more than 5*10-5 of the total cellular UMIs on average in at least one of the 9 layers), each profile normalized to maximum of 1.

