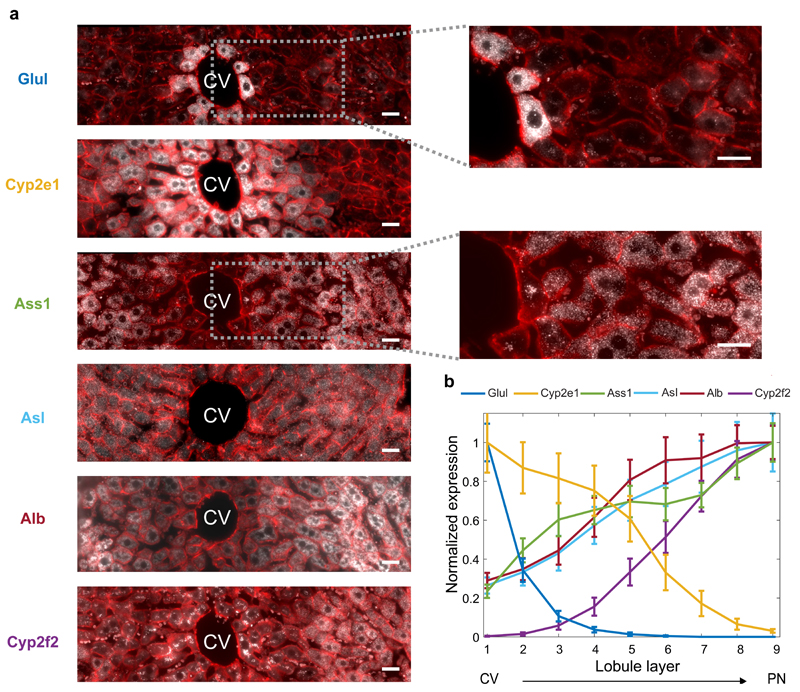
Fig. 2. A spatial barcode of zonated landmark genes.
(a) smFISH micrographs of our landmark genes. Gray dots - single mRNA, Red - phalloidin-stained membranes. Insets show pericentral regions of the spatially-discordant genes Glul (top) and Ass1 (bottom), demonstrating the dynamic range of smFISH. Scale bar-20µm. CV-central vein. Micrographs are representative of at least 10 lobules and two mice per gene. (b) Zonation profiles of the landmark genes. X axis is the scaled distance from the CV, Y axis is the max-normalized expression level. All landmark genes are highly significantly zonated (Kruskal-Wallis p<10-98). Errorbars are s.e.m. based on at least 800 cells from 10 lobules and two mice.

