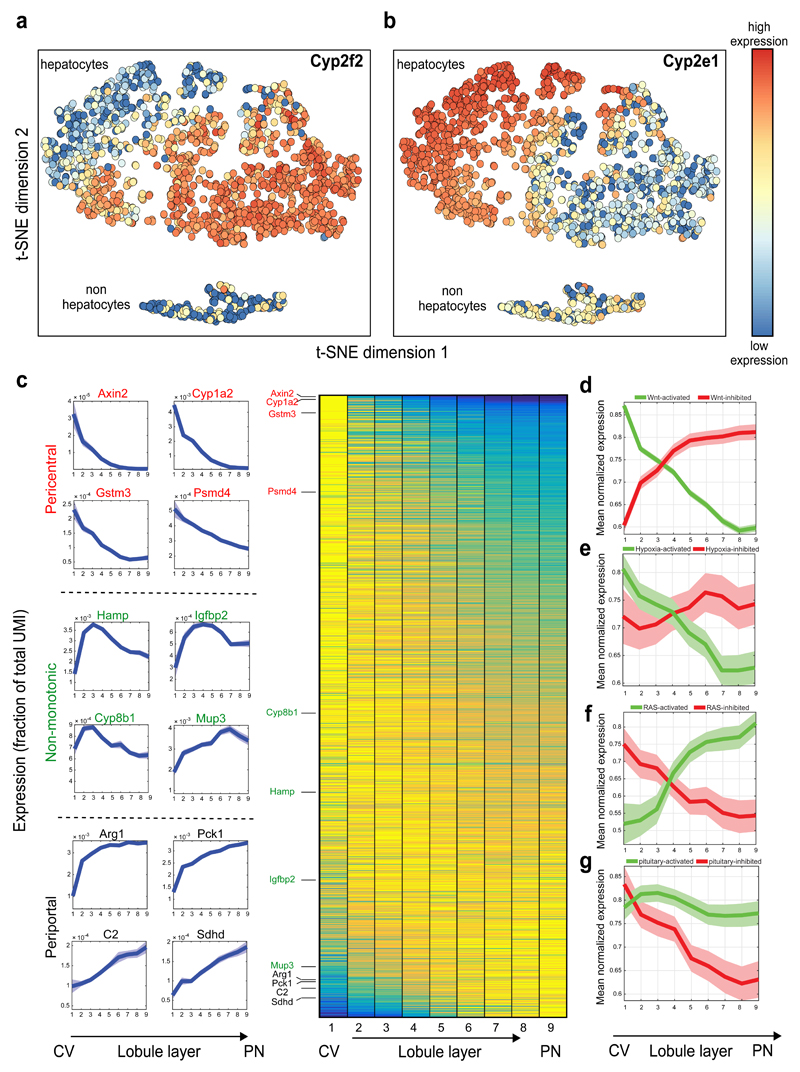
Fig. 3. Genome-wide zonation patterns revealed by spatially-resolved single-cell RNAseq.
(a-b) t-SNE visualization of the scRNAseq data. Colors denote relative cellular expression of landmark genes Cyp2f2 (a) and Cyp2e1 (b). (c) Zonation profiles of the 3496 significantly zonated genes. Genes sorted by the profiles’ centers of mass. Left-examples of pericentral, periportal and non-monotonic profiles. (d-g) Signaling pathways affecting liver zonation. Shown are average zonation profiles, patches are s.e.m. (d) Green-Wnt-activated genes19 (n=810), red-Wnt-inhibited genes19 (n=193). (e) Green-hypoxia activated genes20 (n=95), red-hypoxia inhibited genes20 (n=45). (f) Green-Ras-activated genes22 (n=43) red-Ras-inhibited genes22 (n=50). (g) Green-genes reduced (n=81), red-genes increased (n=51) in expression in hypopituitary mice23.

