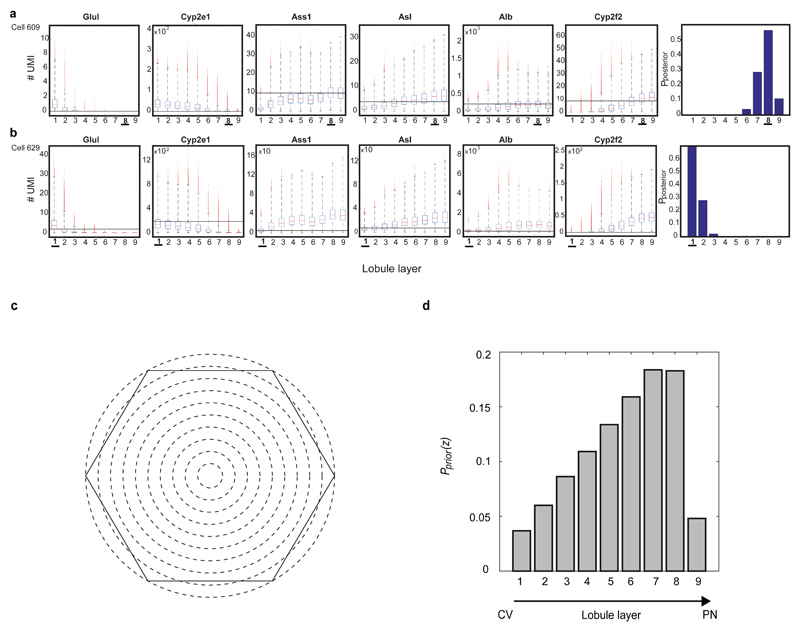
Extended Data Figure 3. Prior and posterior probability computation of the scRNAseq data.
(a-b) Zone-dependent probabilities of observing different expression levels for each of the six landmark genes. Horizontal lines denote the UMI observed for each gene for cell 609 (a) and cell 629 (b). The posterior probabilities for each layer suggest that cell 609 most probably originated from the periportal layer 8, whereas cell 629 originated from the pericentral layer 1. Note that the posterior probabilities incorporate the lower sampling of cell 609, which had a total of 3,358 UMI, compared to cell 629, which had 9,913 UMI. (c-d) Prior probability of observing a hepatocyte from each of the 9 layers. (c) Hexagonal lobule geometry and 9 concentric circles at constant radii increments spanning the central vein and portal node. (d) Area of each layer is the intersection with the hexagon.

