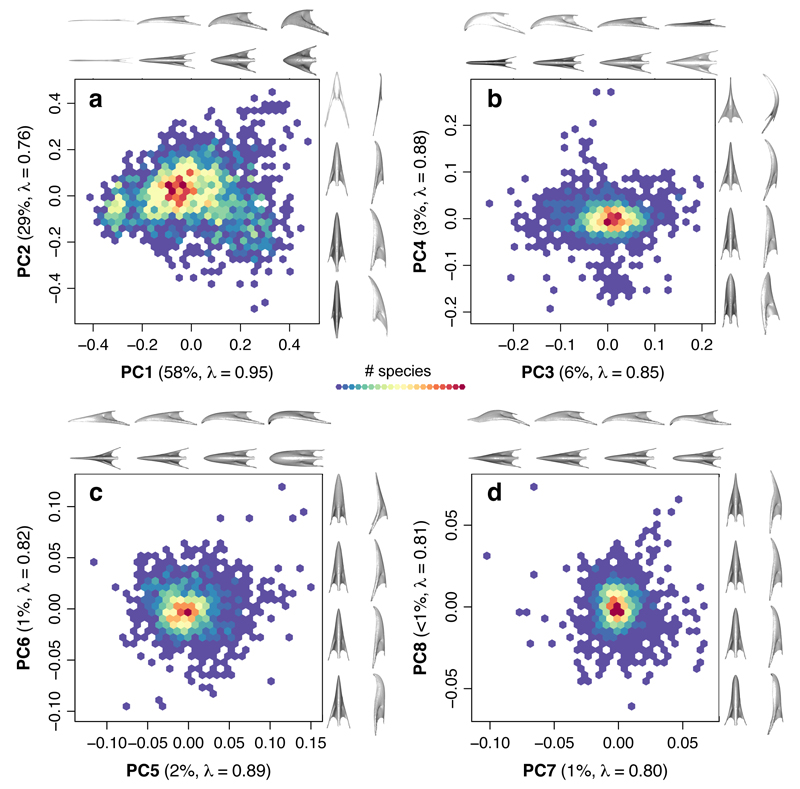
Figure 1. Bird bill morphospace density plots.
PC axes 1-8 are shown as pairwise scatterplots, along with warps representing the change in bill shape (n = 2028 species) along each axis in dorsal and lateral views. Each axis is labeled with the proportion of variance explained and estimates of phylogenetic signal (Pagel’s λ). The colour scale refers to the number of species in 20 bins with minimum and maximum richness of a, 1-23 b, 1-72 c, 1-64, and d, 1-98 species, respectively.

