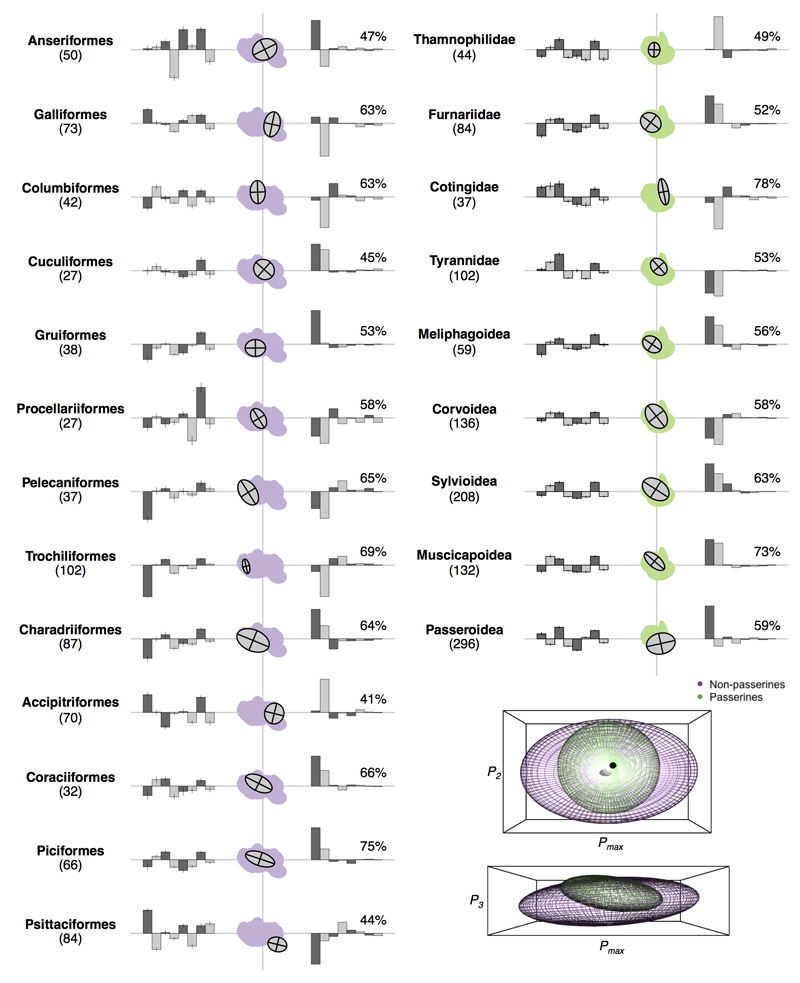
Extended Data Figure 7. Morphological subspaces of the P of avian higher taxa.
The figure shows representations of P for avian higher taxa with ≥20 species sampled. First column: distribution of species values on each of the first eight raw PCs showing variation in morphospace centroid for each higher taxon. Second column: two-dimensional subspace for each taxon with non-passerine (purple) and passerine (green) subspaces. The x- and y-axes follow the global leading (Pmax) and secondary eigenvectors. Third column: percentage of total variance explained and individual PC loadings onto each taxon specific Pmax. Inset: three-dimensional subspace for all non-passerines (purple) and passerines (green). Values in parentheses show the number of species sampled.

