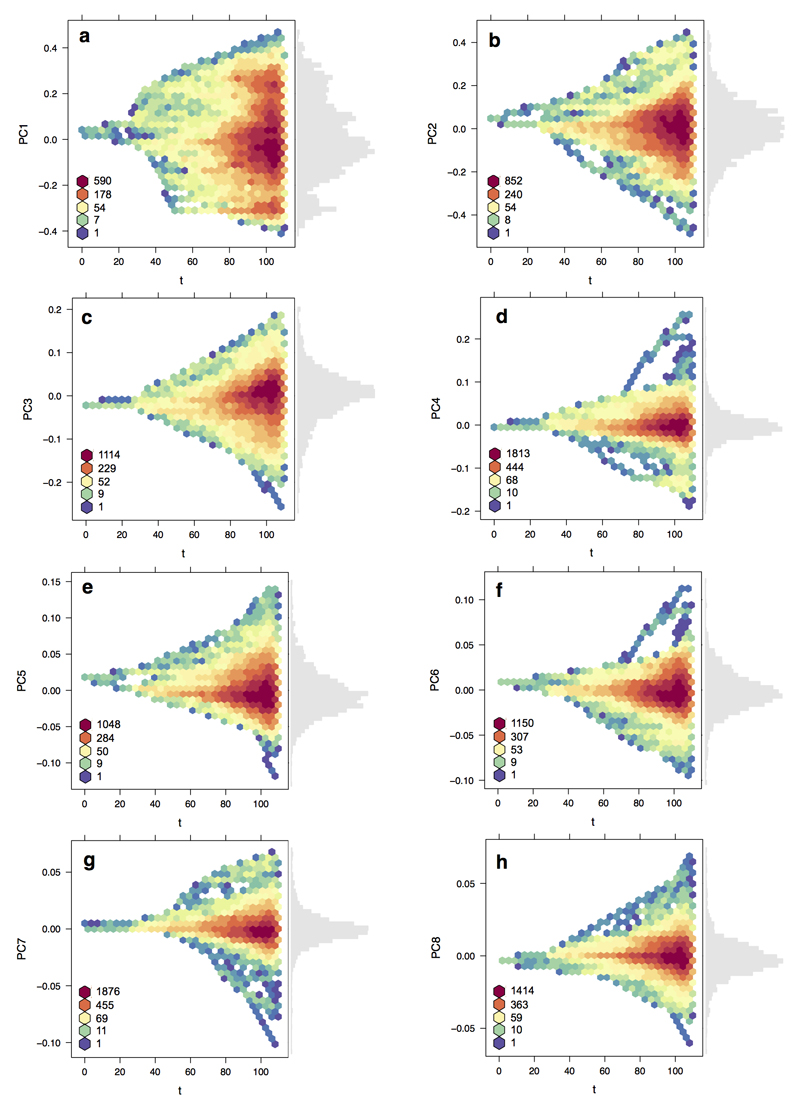
Extended Data Figure 2. Morphospace density through time.
Plots show the filling of avian bill morphospace through time (n = 2028 species) for PCs a,1; b, 2; c, 3; d, 4; e, 5; f, 6; g, 7; and h, 8. Densities were calculated in 1 million year time slices based on univariate rate heterogeneous models of trait evolution using a stage 2 Hackett MCC tree from www.birdtree.org. The scale runs from low density (blue) to high density (red), indicating the extent of niche packing through time in different regions of bill morphospace. For each axis the frequency distribution of PC scores among species is also shown (grey bars).

