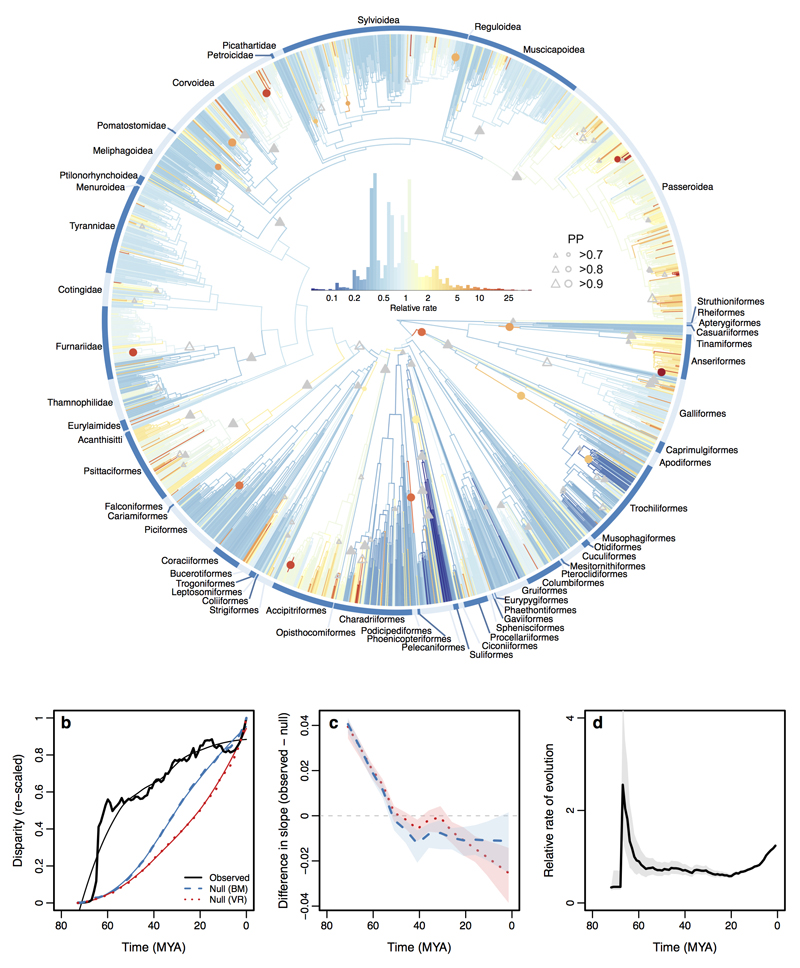
Extended Data Figure 4. Multivariate rates of bill shape evolution for a composite tree based on the Prum et al. backbone.
The avian phylogeny coloured according to estimates of the mean relative multivariate rate of bill shape evolution. Grey triangles show the stem branch of clades with support for whole clade shifts in evolutionary rate. Coloured circles show rate shifts on individual internal branches (colour indicates the rate estimate). The relative size of triangles and circles indicates the posterior probability (PP) of a rate shift. Filled and open triangles distinguish between shifts on the focal node (filled) and shifts that occur either at the focal node or on one of the two immediate daughter nodes (open).

