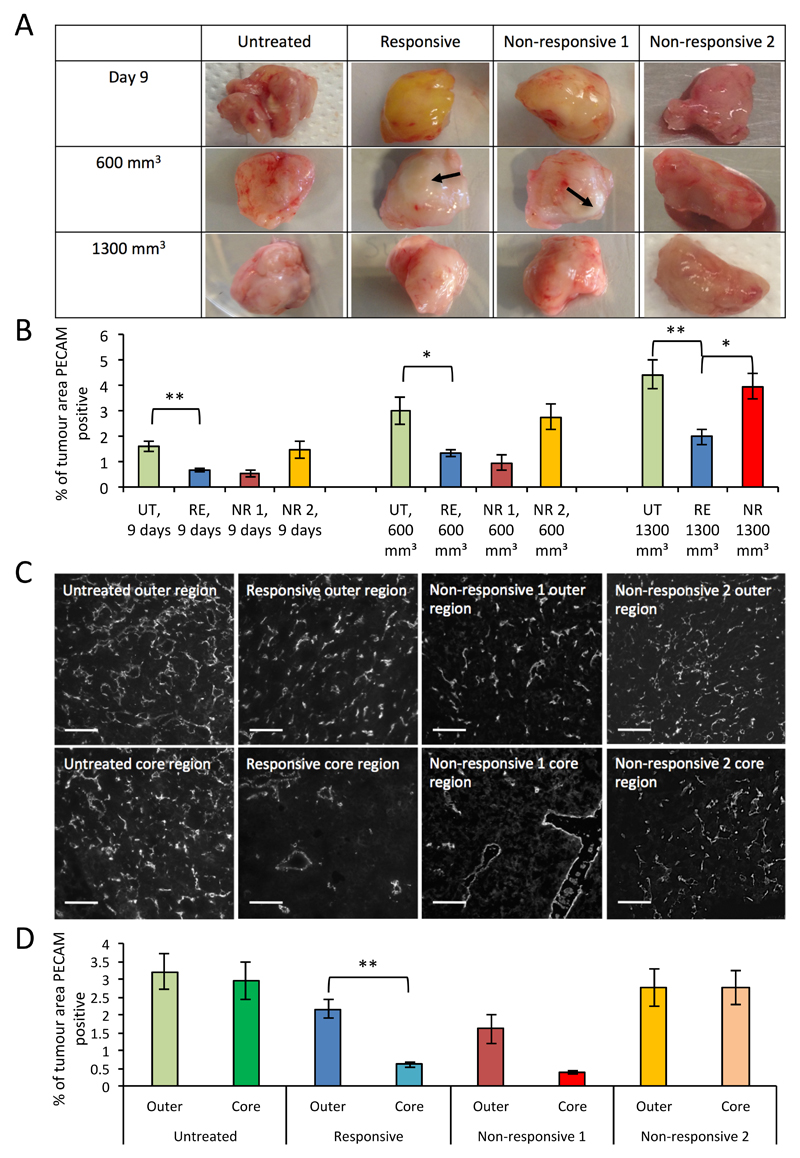
Figure 2. Sunitinib treatment reduces vascularity and impacts vascular patterning of 4T1 tumours.
A, representative images of tumours from each cohort and experimental endpoint, showing macroscopic vascular patterning, not to scale. Avascular regions marked with arrows. B, bar chart of vascular density of tumours from each cohort and experimental endpoint, determined by the average percentage of PECAM immunofluorescent staining across 10 fields of view (mean ± SEM, Mann-Whitney, ** p<0.01, * p<0.05, n-numbers: Day 9, responsive (RE)=9, non-responsive 1 (NR 1)=3, non-responsive 2 (NR 2)=3, untreated (UT)=15; 600mm3, RE=9, NR 1=2, NR 2=4, UT=15; 1300mm3, RE=13, NR=7, UT=18.). C, representative images of immunofluorescent PECAM-1 staining in the core and outer regions of tumours from each cohort of tumours, taken at 600 mm3. D, bar chart of vascular density in the core and outer regions of tumours from each cohort, taken at 600 mm3, determined by the average percentage of PECAM immunofluorescent staining across 5 fields of view (mean ± SEM, statistics and n-numbers as in B).

