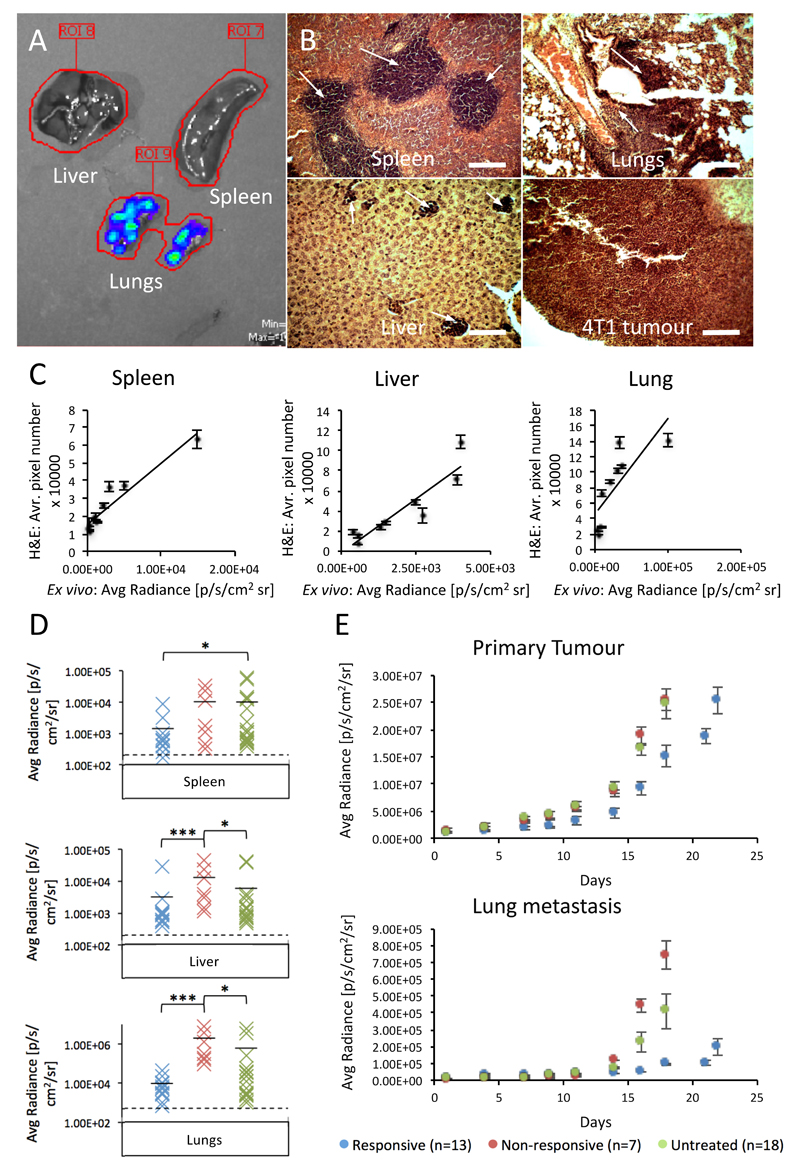
Figure 3. Sunitinib treatment enhances 4T1 tumour metastasis, but only in the innately resistant setting.
A, representative image of liver, spleen and lung whole organs undergoing bioluminescent imaging by the IVIS (overlay of blue-green-red colouring represents bioluminescence of increasing intensity. B, representative images of H&E staining of 4T1 tumour and metastasis in spleen, lungs and liver (metastasis marked by white arrows). Scale bar = 100 μm. C, correlation between metastatic burden, as determined by measurement of average metastatic area across 10 fields of view, in organs stained by H&E and by whole organ bioluminescent pixel density, in spleen, liver and lung tissues (mean ± SEM, n=10). D, distribution plots of bioluminescence from each organ and cohort at the 1300 mm3 endpoint. Cohorts are coloured as follows (Responsive – blue, Non-responsive – red, Untreated – green). The level of background auto-fluorescence measured by imaging of organs from mice with no tumour is also displayed (dashed line). Statistical analysis: Mann-Whitney, *** p<0.001, * p<0.05. E, longitudinal bioluminescent quantification of primary and secondary lung tumour development, generated by bioluminescent imaging of the whole mouse with regions of interest drawn over the tumour and lung areas (mean ± SEM, n-numbers as displayed).

