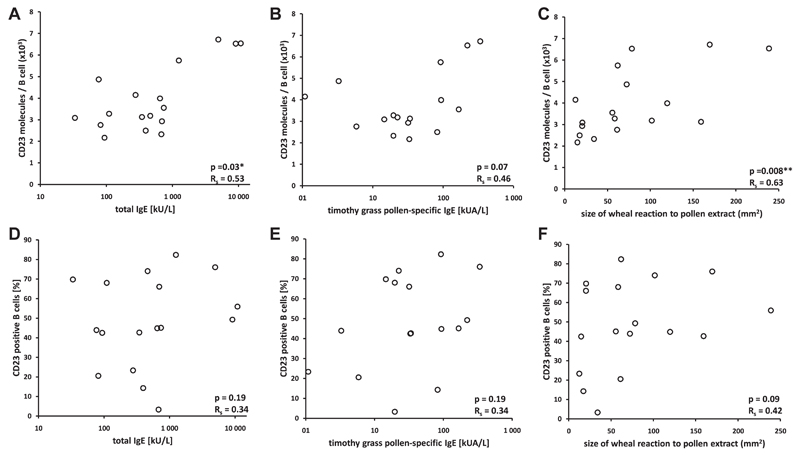
Fig 1.
Associations of numbers of CD23 molecules per B cell and percentages of CD23+ B cells with skin sensitivity to grass pollen allergens and total and grass pollen–specific IgE levels. Numbers of CD23 molecules per CD23+ B cells (A-C) or percentages of CD23+ B cells (D-F) are displayed on the y-axis. Total IgE levels (Fig 1, A and D), timothy grass pollen–specific IgE levels (Fig 1, B and E), or sizes of grass pollen–induced wheal reactions (Fig 1, C and F) are plotted on the x-axis. *P values of less than .05. **P values of less than .01.

