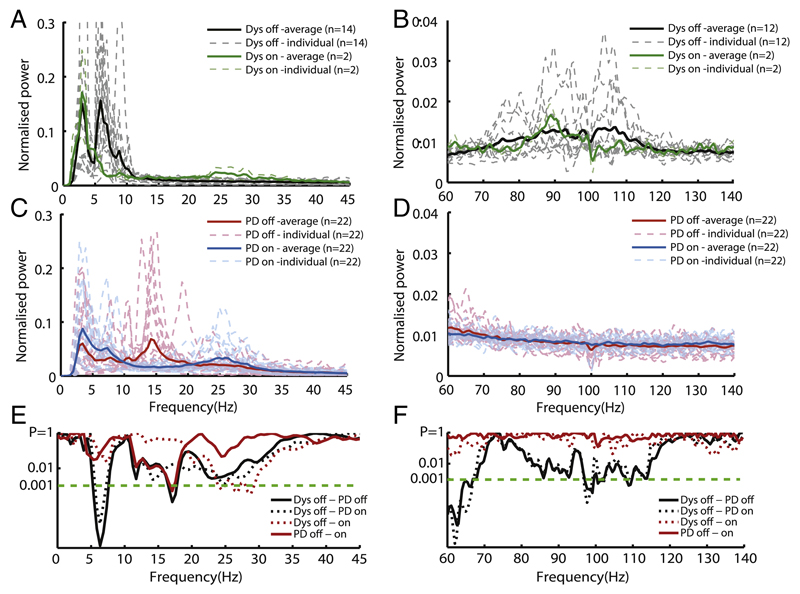
Fig. 1.
Group power spectra over 0–45 Hz (left) and 60–140 Hz (right) averaged across subjects with dystonia off medication (A and B, black line) and separately for case d8 on clonazepam and aripiprazole (A and B, green line); PD off levodopa (C and D, red line) and on levodopa (C and D, blue line). Dashed lines show individual spectra of all subjects in the respective conditions. Results of serial two-sample, unpaired t-tests between dystonia off medication and PD groups, one-sample t-tests between dystonia off medication and averaged case d8 on medication and paired t-tests between PD off and on (E and F). LFPs were z-transformed before spectral analysis. Spectral resolution is 0.5 Hz. Note ln (P) y axis scales in E and F.

