Figure 2.
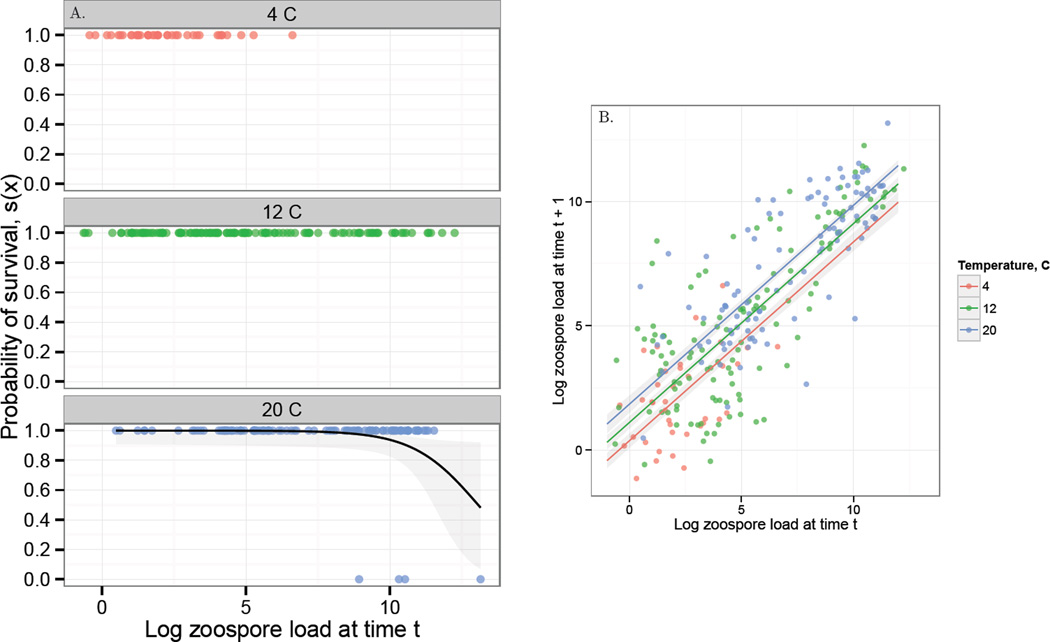
A. The laboratory data used to estimate the survival function s(x). Each panel gives a different temperature and each point gives the load of an individual frog at time t and whether it survived to time t+1. A value of 1 indicates that a frog survived and a value of 0 indicates that it died. No frogs died in temperature treatments 4 and 12 °C. The black line in the 20 °C plot gives the fit of the temperature-independent survival function used in the analysis, plus or minus the standard error about the prediction. B. The laboratory Bd growth data and corresponding temperature-dependent growth function G(x′, x) from the Bd-Rana muscosa laboratory experiment. Each point gives the log zoospore load on an individual at time t and time t + 1. The different colors show different temperatures. The corresponding lines give the predicted growth function for a given temperature along with the standard error about the predicted mean. Growth of Bd on an individual frog increases with both temperature and the number of zoospores at time t. Alternative models for this growth function are discussed in SI 1.

