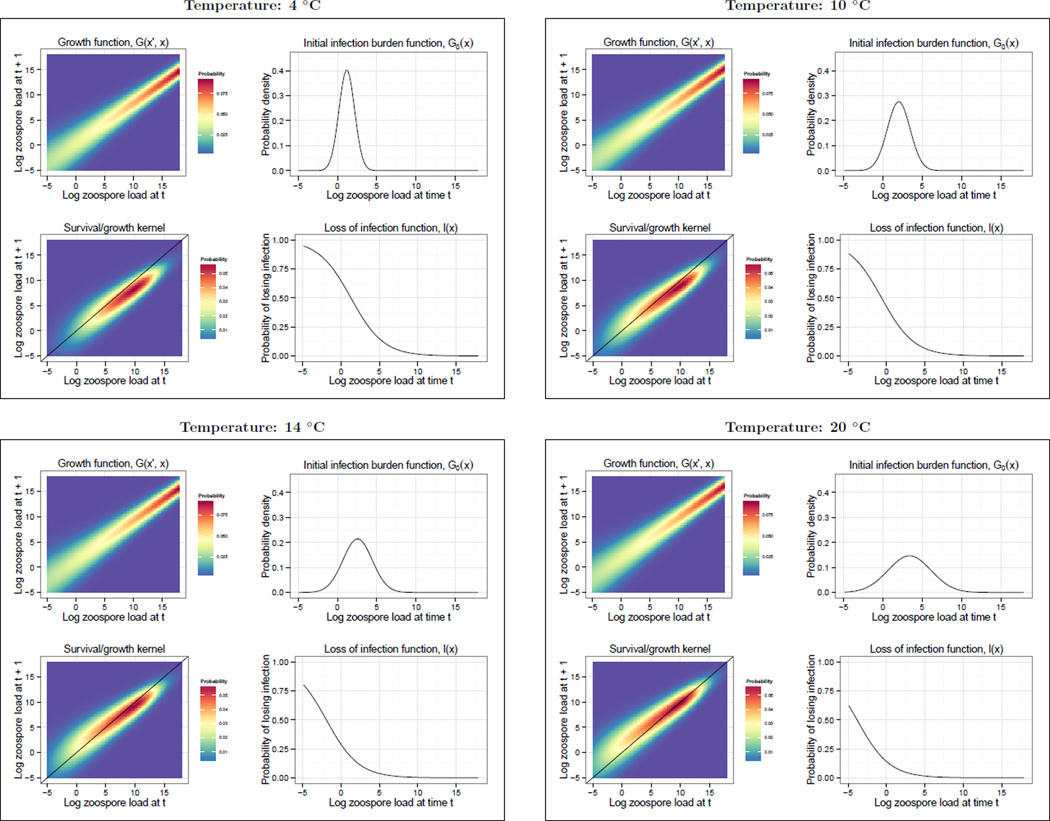
Figure 3.
The growth function G(x′, x), loss of infection function l(x), initial infection burden function G0(x′) and the survival/growth kernel (G(x′, x)s(x)) used to parameterize the Bd-Rana muscosa Integral Projection Model for temperatures between 4 and 20 °C. The four temperatures shown were chosen to illustrate how the various vital rate functions change with temperature. Because each vital rate function shown is a linear function of temperature (see Vital rate functions) we were not restricted to choosing the 3 temperatures used to fit the vital rate functions (4, 12, and 20 °C) and could chose any temperature between 4 and 20 °C. The black line on the survival/growth kernel plots is a one to one line representing stasis: above this line the Bd load on a host gets larger in a time step and below this line the Bd load on a host gets smaller in a time step.

