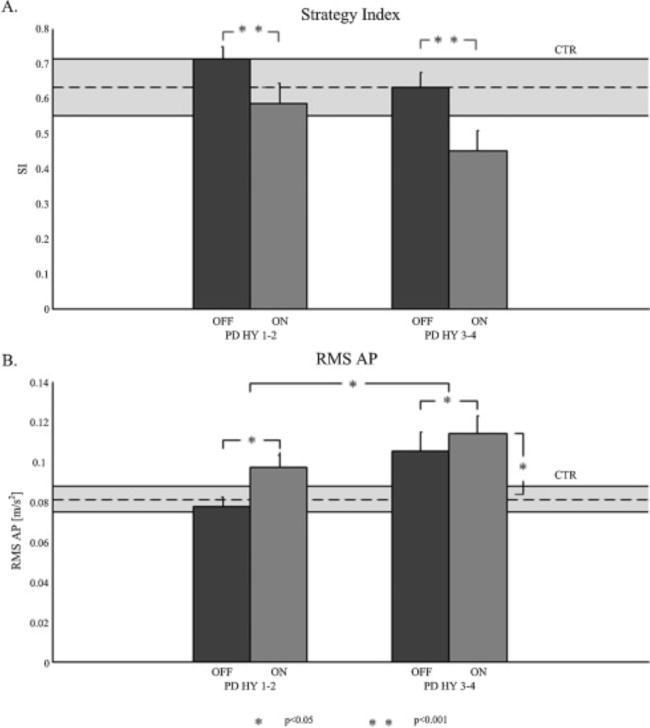
Figure 1.

(A): mean values and standard errors of Strategy Index (SI) for PD H&Y 1–2 (mild group), OFF and ON, and PD H&Y 3–4 (severe group), OFF and ON. SI for controls is represented in the stripe behind. (B): mean values and standard errors of the root mean square of acceleration in antero-posterior direction (RMS AP) for PD H&Y 1–2 OFF and ON, and PD H&Y 3–4 OFF and ON. RMS AP for controls is represented in the stripe behind.
