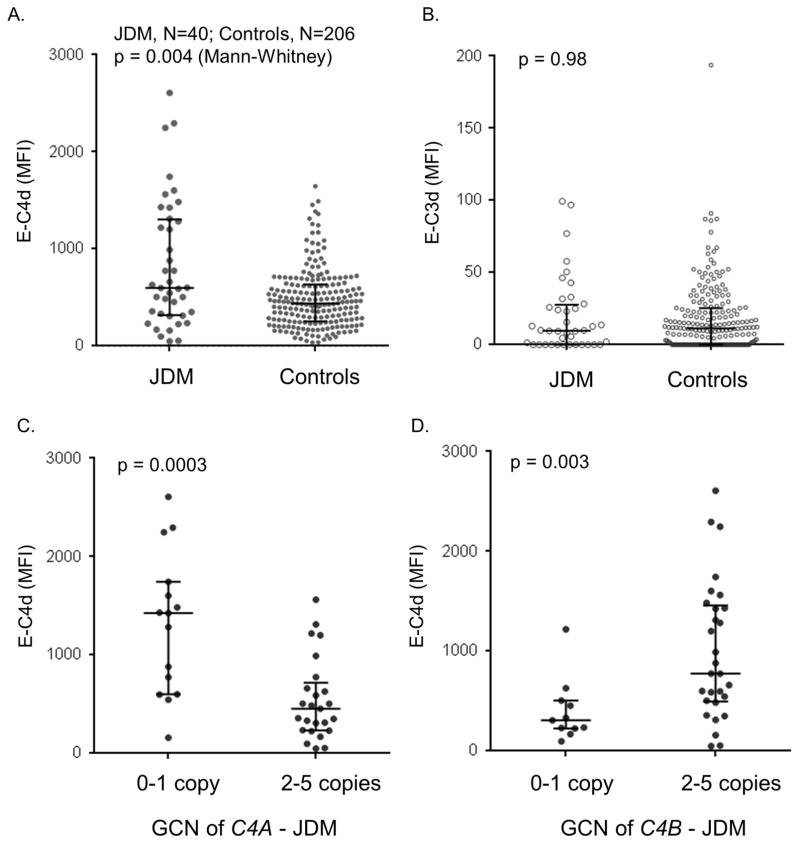
Figure 2.
Erythrocyte-bound E-C4d and E-C3d in JDM patients and controls. A and B. A comparison of E-C4d and E-C3d, respectively, in JDM and controls. C. A comparison of E-C4d in C4A-deficient and C4A-proficient JDM patients. D. A comparison of E-C4d in C4B-deficient and C4B-proficient JDM patients. The median for each group is indicated by a horizontal bar, while the shorter bars represent interquartile ranges; the p-value for Mann Whitney test is indicated.

