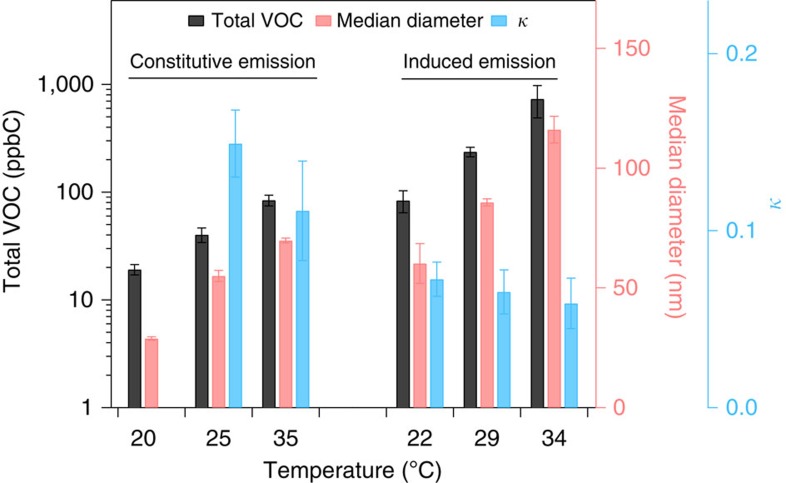
Figure 3. Effect of heat on emission amounts and particle properties.
The mixing ratios of total volatile organic compounds (VOC) from plant emissions (black bar, note log axis), median diameter of aerosol particles (red bar) and hygroscopicity parameter κ (blue bar) is plotted as a function of plant temperature. The constitutive emissions from unstressed pine trees and induced emissions from stressed mixed boreal trees are shown. The error bars represent the s.d. of the measurement (the detailed number of measurements included in Supplementary Table 4). For constitutive emissions at 20 °C, κ data are not available (noted by *) because particle sizes were too small (median diameter 26 nm) for cloud condensation nuclei (CCN) activation measurements.

