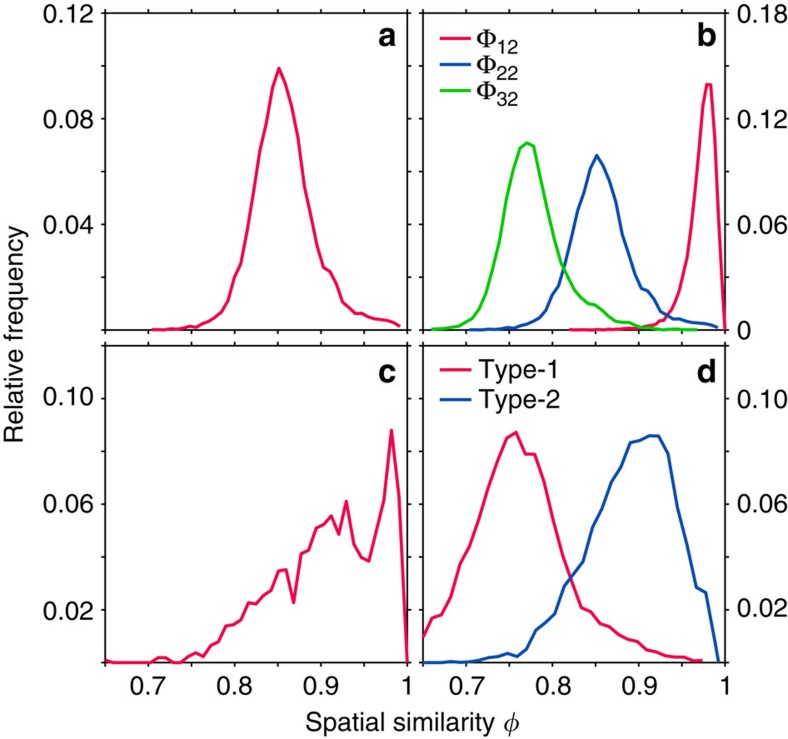
Figure 3. Example LSU distributions.
(a) The distribution of spatial similarity statistics for tree comparisons of depth 2 and locality 2 (Φ22) for an amorphous diamond network. (b) LSU distributions Φn2 of amorphous diamond for different tree depths n. (c) Φ22 for a 216-vertex sample comprising a single gyroid crystallite suspended in amorphous gyroid, demonstrating LSU's ability to differentiate between phases. (d) Φ22 distributions for two characteristic types of amorphous gyroid network—type-1 (1-tree local order) and type-2 (2-tree local order).

