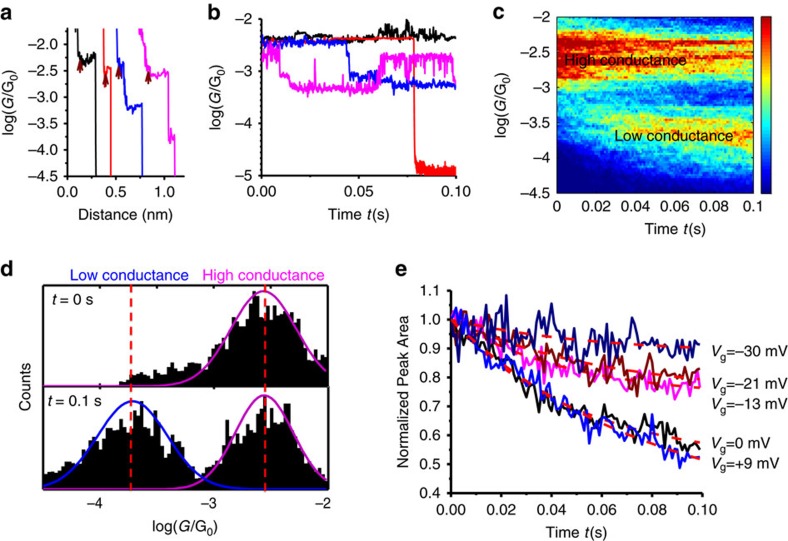
Figure 5. Kinetic analysis of redox reactions in single-DNA molecules.
(a) Conductance versus distance traces, each shows a plateau that corresponds to a DNA molecule bridged between the tip (source) and substrate (drain). The arrows mark the locations where the tip was fixed in position, and conducting switching events versus time were studied. Each trace leads to a G–t (conductance–time) trace with the same colour in b. (b) Three conductance switching behaviours: conductance stays at the high conductance level over the time window (black), conductance switches to the low conductance level and stays at that level (blue) and conductance switches back and forth between the two levels (magenta). Note that red trace shows that conductance drops to zero, due to the breakdown of the DNA junction. See text for more details. (c) 2D conductance (G) versus time (t) histogram with the gate voltage (Vg) set at 0.000±0.005 V, showing two discrete conductance bands, and dependence on time. (d) Conductance histogram at t=0.0 and 0.1 s, showing transition from high conductance state to a mixture of high and low conductance states. (e) Normalized peak area of the high conductance peak versus time under different gate voltages, where the red dashed lines are the fitting of the curves with the rate equation (4).

