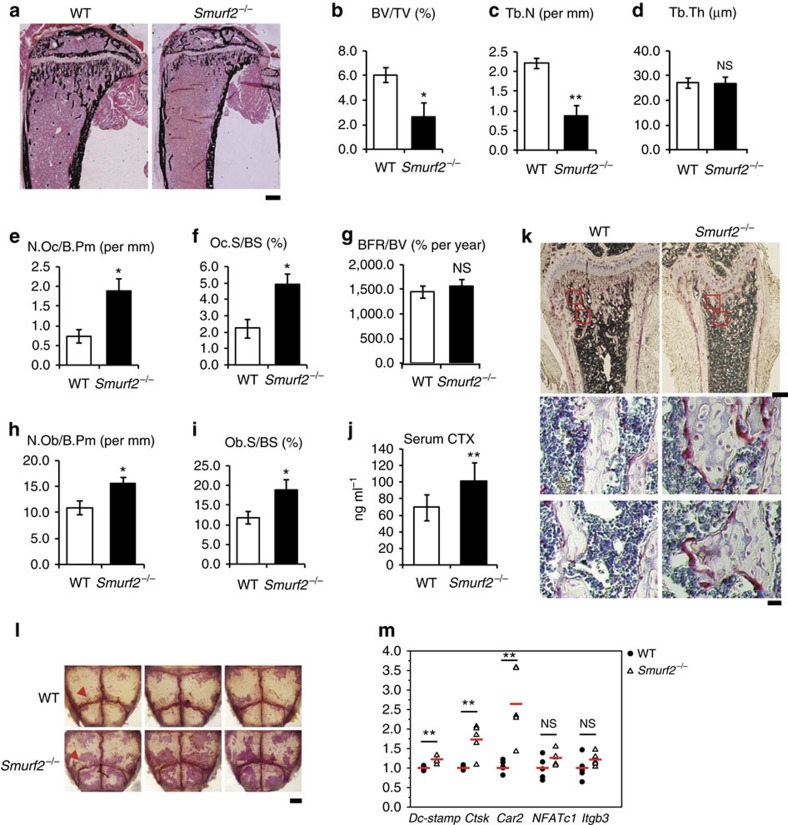
Figure 3. Smurf2−/− mice have increased bone resorption.
(a–i) Histomorphometric analysis of proximal tibia from 5-week-old WT and Smurf2−/− male mice for bone volume per tissue volume (BV/TV), trabecular number (Tb.N), trabecular thickness (Tb.Ths), number of osteoclasts per bone perimeter (N.Oc/B.Pm), osteoclast surface per bone surface (Oc.S/BS), bone formation rate per bone volume (BFR/BV), number of osteoblasts per bone perimeter (N.Ob/B.Pm) and osteoblast surface per bone surface (Ob.S/BS). Scale bar, 500 μm. Data represent mean±s.d. (n=6 for each genotype, **P<0.01, *P<0.05, NS, not significant. Student's t-test). (j) Serum CTX levels in 5-week-old male WT and Smurf2−/− animals. (k) Histological sections of 4-week-old male mice's control and Smurf2−/− tibias stained for tartrate-resistant acid phosphatase (TRAP). Scale bars, upper 500 μm; bottom 10 μm. (l) Representative photographs of whole-mount TRAP staining of 4-week-old male mice (pink, arrows highlight prominent staining near sutures). Scale bar, 1 mm. (m) Quantitative reverse transcriptase–PCR analysis of osteoclast-specific genes in calvarium of 4-week-old male mice. Data represent mean±s.d. (n=5 for each genotype, ***P<0.001, **P<0.01, *P<0.05, NS, not significant. Student's t-test).

