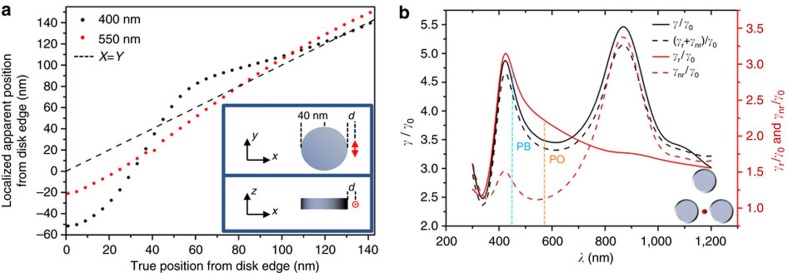
Figure 4. Super-resolution localization improvement and spectral response of emission enhancement factors.
(a) Apparent localized position with respect to the true position for a dipole emitting at 400 nm (black dots) compared to one emitting at 550 nm (red dots) for an Al disk. The dashed line corresponds to perfect localization. As the emission of the dipole is moved towards a lower γ/γ0 radiative enhancement contribution, the error in the localization is notably reduced. (b) For a combined x−y polarized dipole located at the position marked in red on the insert we show the total emission enhancement (black dashed line), radiative enhancement (red solid line) and non-radiative enhancement (red dashed line). Finally we simulate the total emission enhancement effects via calculation of the dyadic Green's function for the structure (black solid line). Note from the spatial distribution of the emission enhancement (Fig. 3d), placing the dipole in another hot-spot of the structure would give the same result.

