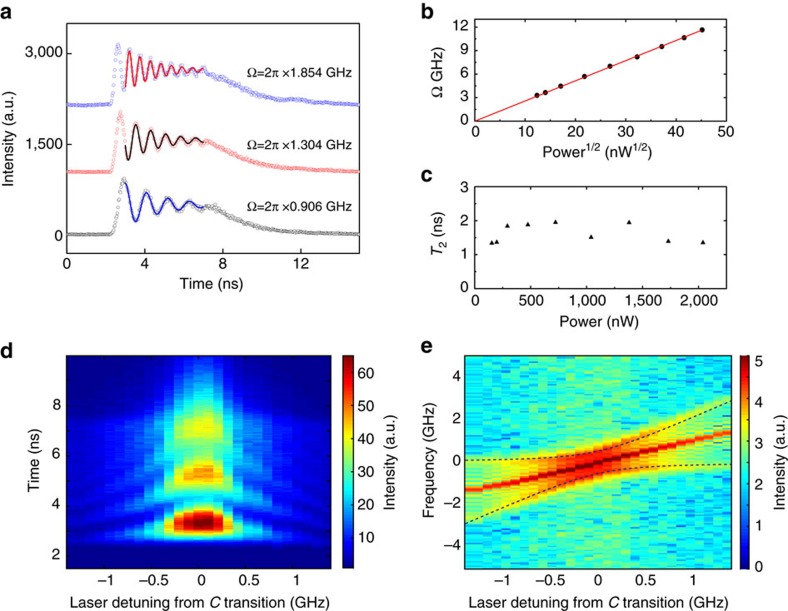
Figure 2. Time-resolved Rabi oscillations.
(a) Rabi oscillations of the C transition when excited with a 5 ns laser pulse at three different excitation powers. Laser pulse period is 15 ns. Fitting of the curves with equation (1) results in the Rabi frequency Ω/2π=0.906, 1.304 and 1.854 GHz. (b) Fitted Rabi frequency for curves in a as a function of the square root of the excitation laser power, exhibiting a linear trend (red line). (c) The extracted T2 times from the fitting as a function of the excitation laser power. No apparent decrease is seen up to 2,000 nW, which corresponds to 300 times the saturation power. (d) Excitation with a fixed Rabi frequency Ω=2π × 1.304 GHz, while modifying the laser detuning from C transition. Different colours represent different intensity amplitude. (e) Fourier Transform analysis of the measurement in d. Two side branches fit well with the theoretical values  (dashed black lines).

