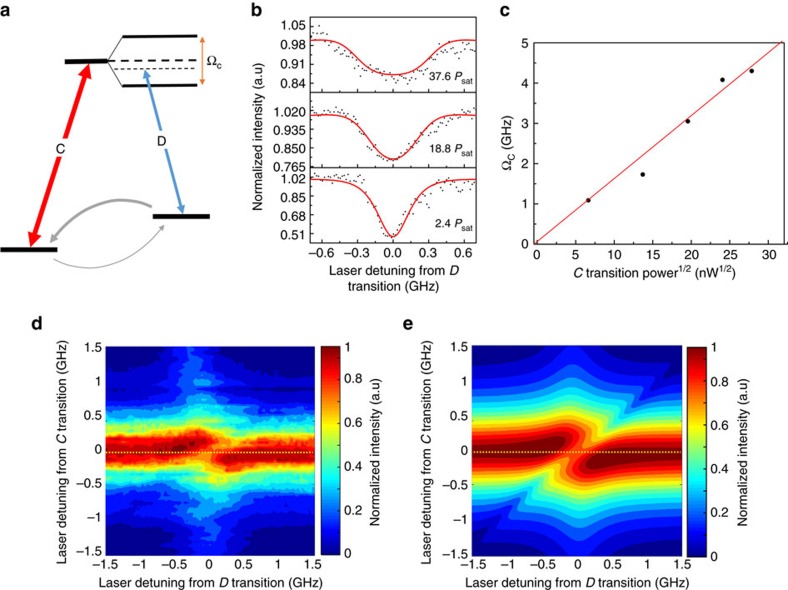
Figure 4. Autler–Townes splitting detection.
(a) Level structure of the Autler–Townes splitting detection scheme. A much stronger laser is resonantly pumping the C transition while a probing laser is detuned on the D transition to detect the excited energy levels. Grey solid arrows represent the decay or relaxation from each level. (b) Experimental (black) and simulated curves (red) for three different laser powers exciting the C transition. The frequency of the excitation laser is fixed, and a second laser scans the D transition in the range of [−0.7 GHz, 0.7 GHz] from resonance. (c) ΩC is extracted from the fit, and plotted as a function of the square root of power of the excitation laser (black dot), the red line is a linear fitting of the extracted data. (d) Experimental data for measuring the Autler–Townes splitting. SiV fluorescence counts are detected as a function of scanning the excitation laser frequency across the D transition in the range of [−1.5 GHz, 1.5 GHz] from resonance, whereas the excitation laser on C is also fixed and stepped in the range of [−1.5 GHz, 1.5 GHz] from resonance. Laser powers are 20Psat and 2.5Psat for C and D transition respectively, the yellow dashed line indicates the same condition as c when the C transition is exactly on resonance. (e) Simulated SiV fluorescence for the experiment in d (for simulation method and values, see Supplementary Note 1).

