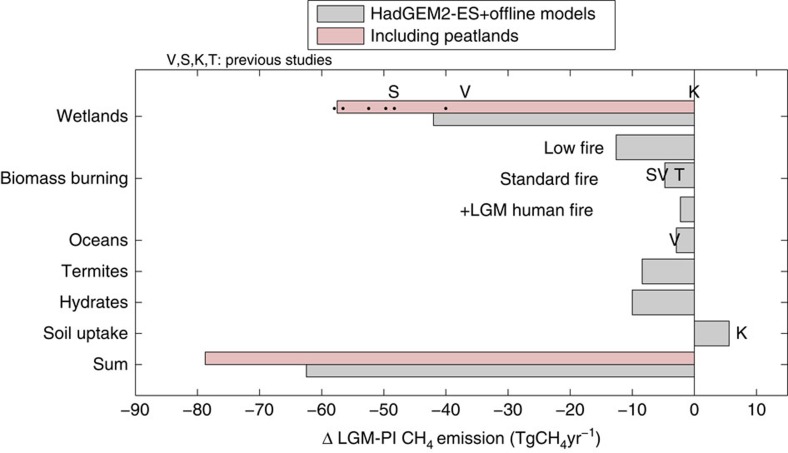
Figure 1. Last glacial maximum minus pre-industrial CH4 emissions.
Emissions change (TgCH4yr−1) for each source term and total. Values in pink include peatland emissions in northern extra-tropics. The sum uses the standard-fire flux. Values from previous work have been scaled to the same pre-industrial fluxes as used in our study for comparison. Wetland emissions from ref. 9 (dots) based on PMIP2 coupled GCM simulations, V: Valdes et al.8, K: Kaplan et al.7,14, T: Thonicke et al.29 and S: Singarayer et al.10. More details are provided in Table 1.

