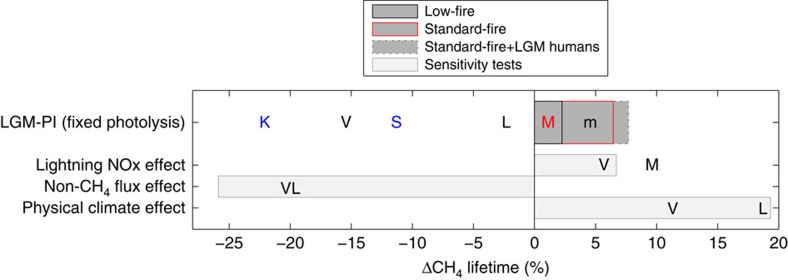
Figure 2. Last glacial maximum atmospheric CH4 lifetime change relative to the pre-industrial (%) and estimates of the separate contributions to this change.
LGM minus pre-industrial relative CH4 lifetime change (dark upper bar), and sensitivity experiments (perturbation minus LGM), light bars below. V: Valdes et al.8, K: Kaplan et al.7,14, L: Levine et al.15, S: Singarayer et al.10 and Murray et al.16, for which only warm-LGM simulations are included and where m denotes the low-fire scenario. The effects of physical climate changes on reaction rates were not accounted for by Kaplan et al.14 or by Singarayer et al.10 shown in blue. Note for the BVOC sensitivity tests, Valdes et al.8 only changed isoprene and terpene emissions, Levine et al.15 also changed CO, ethane, propane and acetone; while here soil NOx was also included. Details of all of the lifetime results are given in Table 2.

