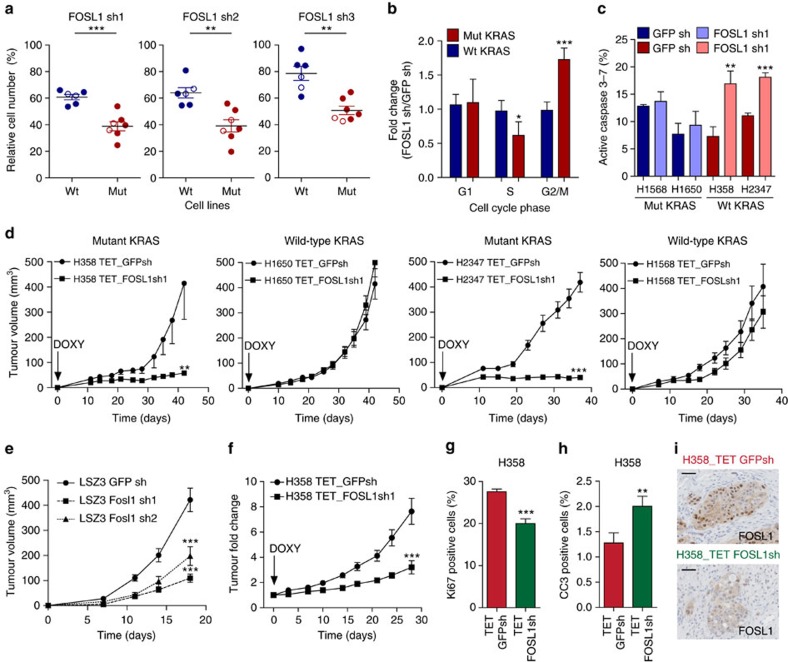
Figure 3. Impact of FOSL1 inhibition on LAC cell proliferation in vitro and in vivo.
(a) Percent cell viability of human wild-type (HCC78, H1437, H1568, H1650, H1703 and H2126) and mutant (H23, H358, H441, A549, H1792, H2009 and H2347) KRAS LAC cell lines with three independent FOSL1 shRNAs. Data are relative to number of cells expressing a GFP shRNA. Relative cell number was assessed by an MTS assay for 4 days and repeated three times. (b) Cell cycle analysis using an EdU incorporation assay of mutant (H358 and H2347) and wild-type (H1568 and H1650) KRAS cell lines expressing an inducible shRNA against GFP or FOSL1. shRNA expression was induced by doxycycline (1 μg ml−1) for 3 days and then cells plated for 24 h before analysis. Data are normalized to cells expressing a GFP shRNA. Result is average of three independent experiments. Error bars correspond to s.d. (c) Analysis of active caspase 3/7 in the same cells as in (b). Data are normalized to cells expressing a GFP shRNA. Result is average of three independent experiments. Error bars correspond to s.d. (d) Average tumour volume of xenografts from H358, H2347, H1568 and H1650 cells expressing an inducible GFP or FOSL1 shRNA (n=8–12 per group). Mice were fed 2 mg ml−1 doxycycline plus 5% sucrose in drinking water when cells were implanted. Error bars correspond to s.e.m. (e) Average tumour volume of xenografts from mouse LAC cells (LSZ3) transduced with a control GPF shRNA (circle) and two shRNAs (square and triangle) against Fosl1 (n=8 per group). Error bars correspond to s.e.m. (f) Average tumour volume change of xenografts from H358 cells with inducible GFP and FOSL1 shRNAs (n=12 per group) relative to start of doxycycline treatment. Doxycycline treatment (2 mg ml−1 doxycycline plus 5% sucrose in drinking water) started at day 18 when tumours had an average volume of 80–100 mm3. Error bars correspond to s.e.m. ***P<0.001. (g) Analysis of Ki67 positive cells in representative areas (n=15 per group) of tumours in (f). Error bars correspond to s.e.m. ***P<0.001. (h) Analysis of cleaved caspase 3 positive cells in representative areas (n=10 per group) of tumours in (f). Error bars correspond to s.e.m. P value obtained using a Student's t-test. *P<0.05; **P<0.01. ***P<0.001. (i) Immunohistochemistry to detect FOSL1 expression in representative sections of the same tumours as in (f). Scale bars 50 μm.

