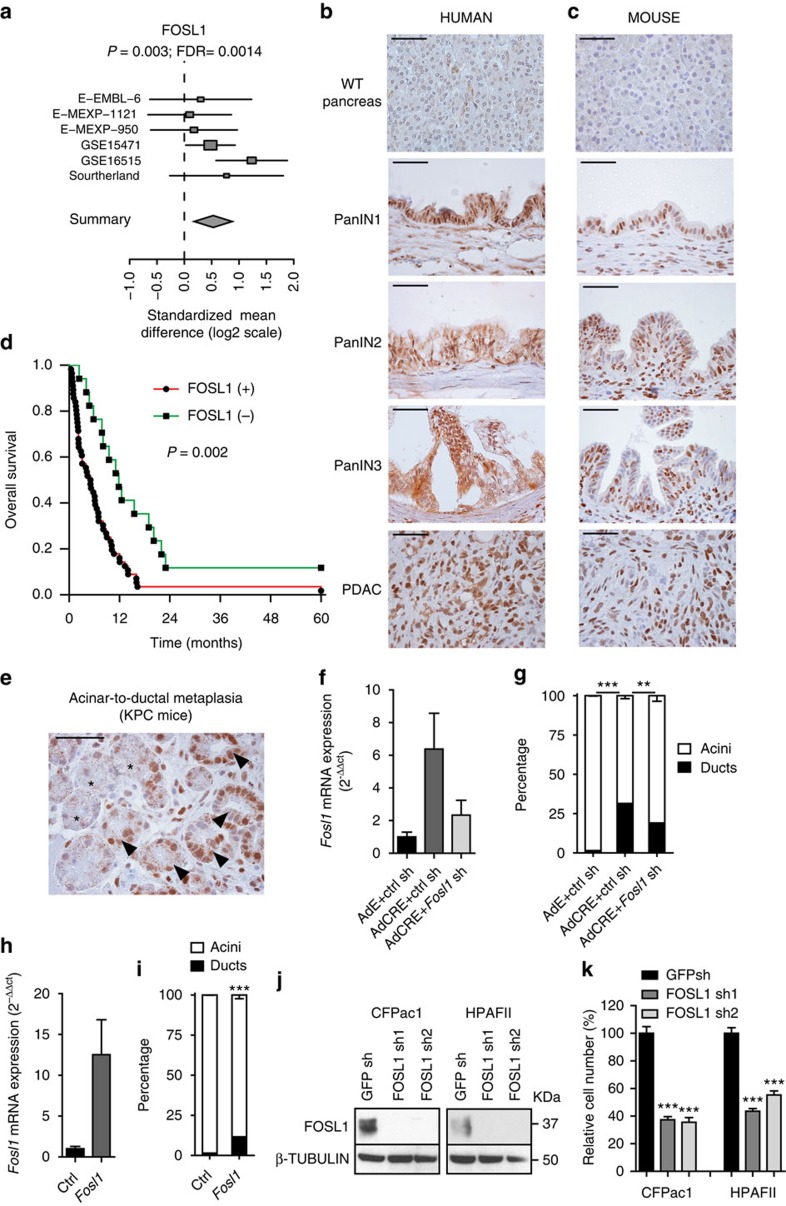
Figure 5. Requirement for FOSL1 expression in PDAC.
(a) Standardized Mean Difference (log2 scale) of FOSL1 mRNA expression meta-analysis across six PDAC data sets. (b,c) FOSL1 protein expression by immunohistochemistry in normal pancreas, pancreatic intraepithelial neoplasias and PDAC of human (b) and mouse (c) tissues. Scale bars: 50 μm. (d) Kaplan–Meier plot of FOSL1 protein expression in PDAC patients. (e) Immunohistochemistry for FOSL1 detection in normal pancreas acini (stars) and ADM (arrowheads) in p48cre/+, KrasloxG12D, Trp53Δ/Δ (KPC) mice. (f) Fosl1 mRNA expression in acinar cells from KrasloxG12D mice treated with control adenovirus (AdE), adenovirus Cre (AdCre) and AdCre plus a shRNA targeting Fosl1. (g) Percentage of acinar (white) and ductal (black) clusters in the same ADM experiment as in (f). Two independent organoid cultures were seeded in triplicate. After 5 days in culture, three areas were counted at random in each triplicate. (h) Fosl1 mRNA expression in acinar cells from Kras+/+ mice expressing an empty (ctrl) and a Fosl1-expressing vector. (i) Percentage of acinar (white) and ductal (black) clusters in the same ADM experiment as in (h). Two independent organoid cultures were seeded in triplicate. After 5 days in culture, three areas were counted at random in each triplicate. (j) Western blot analysis of FOSL1 protein in mutant KRAS PDAC cells (CFPac1 and HPAFII) transduced with two independent FOSL1 shRNAs. (k) Relative cell number assessed by MTS of mutant KRAS PDAC cells upon FOSL1 inhibition. Result is representative of three independent experiments. Error bars correspond to s.d. P value obtained using Student's t-test. **P<0.01; ***P<0.001.

