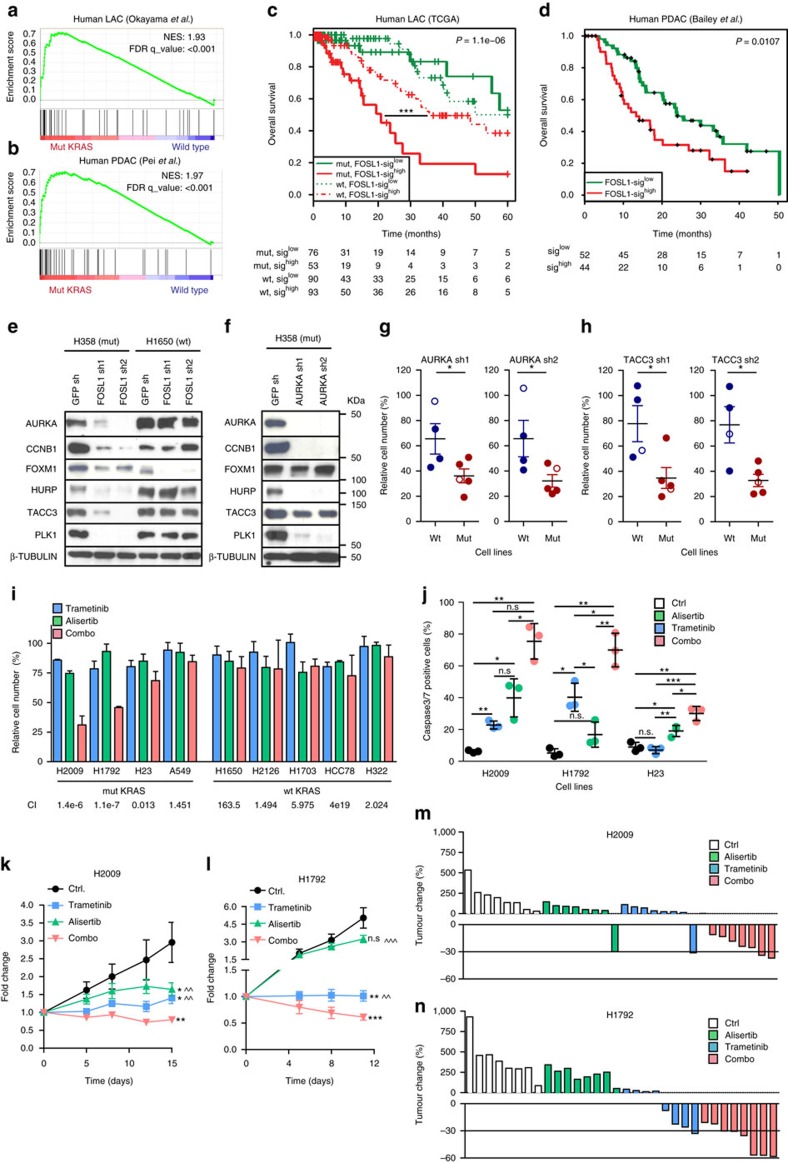
Figure 6. FOSL1 regulates a transcriptional program including genes involved in mitosis progression amenable to pharmacological inhibition.
(a,b) GSEA of human LAC (a) and PDAC (b) data sets comparing mutant KRAS patients to wild-type KRAS patients. (c) Survival analysis of LAC patients (TCGA data set) stratified by KRAS status and expression of a FOSL1 signature. (d) Survival analysis of PDAC patients stratified by expression of a FOSL1 signature. P values obtained using the log-rank test (Mantel-Cox). (e) Western blot analysis on the indicated mitotic genes in mutant (H358) and wild-type (H1650) KRAS LAC cells after FOSL1 inhibition by two independent shRNAs. Western blot is representative of three independent western blots with different lysates. (f) Western blot analysis on the indicated mitotic genes in mutant KRAS LAC cells (H358) after AURKA inhibition by two independent shRNAs. Western blot is representative of three independent western blots with different lysates. (g,h) MTS assay of wild-type (HCC78, H1437, H1650 and H2126) and mutant KRAS (H23, H358, A539, H2009 and H2347) treated with two independent shRNAs targeting AURKA (g) or TACC3 (h). Open circles represent cell lines with similar population doubling time. Error bars correspond to s.d. Assay is average of two independent experiments. (i) MTS analysis of mutant and wild-type KRAS cells lines treated with alisertib (500 nM), trametinib (500 nM) or both. CI: combination index. CI<1 in bold. Results are average of four different independent treatment experiments performed in triplicate. (j) Analysis of active caspase 3/7 cells in H2009, H1792 and H23 cells treated with vehicle, alisertib (1 μM), trametinib (1 μM) or both for 72 h. P values obtained using Student's t-test. (k,l) Analysis of tumour volume of mice injected with H2009 or H1792 cell lines and orally administered vehicle, alisertib (25 mg kg−1), trametinib (1 mg kg−1) or both. Tumours were grown until average tumour volume ranged from 80 to 100 mm3 and randomized before treatment starts. Error bars correspond to s.e.m (n=8 per group). Comparisons to control group: *P<0.05; **P<0.01; ***P<0.001. Comparisons to combo group: ^^P<0.01; ^^^P<0.001. P values obtained using Student's t-test. (m,n) Analysis of tumour change from samples in (i,j) at the end of each experiment (n=8 per group).

