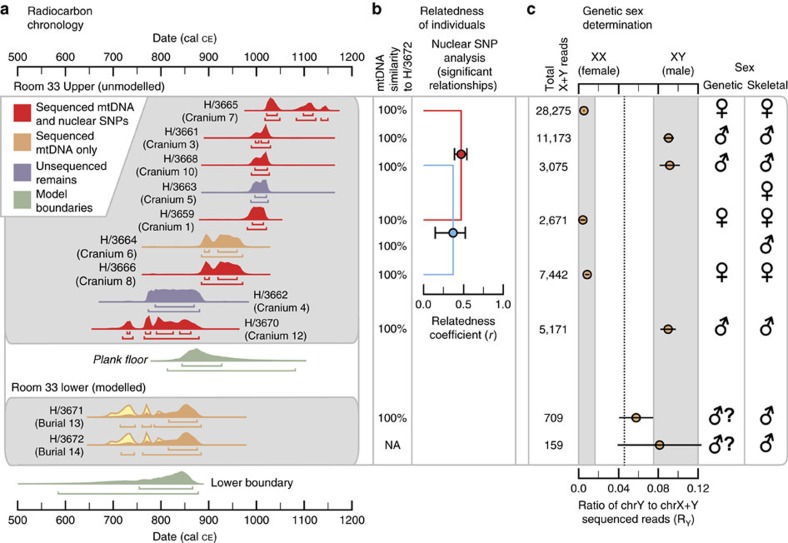
Figure 2. Radiocarbon and archaeogenomic results for individuals buried in room 33.
(a) Bayesian chronological model of calibrated AMS 14C dates for burials 13 and 14 and the estimated age of the wood plank floor, and calibrated AMS 14C dates for nine other crania above the floor in room 33. Calibrated 67.2 and 95.4% AMS date ranges and calibrated posterior probability distributions are illustrated for each cranium. (b) Archaeogenomic relatedness results for mtDNA (nucleotide sequence similarity to burial 14) and the nuclear genome. For the nuclear genome analysis, the estimated relatedness coefficient r (with the 95% confidence interval) is shown for each of the two pairs of individuals with significant genetic relationships. (c) The ratio Ry of the number of non-redundant sequence reads for each individual that mapped to human chromosome Y to the number of total reads that mapped to chromosomes X and Y, with the total number of X+Y reads and the 95% confidence interval indicated. Shaded areas indicate the Ry boundaries corresponding to confident male and female designations, determined with individuals of known sex25. The genetic sex estimates are compared with those from a previous osteological analysis18. Graphical layout: T. Harper. The radiocarbon plot on the left was produced in OxCal 4.2 and graphs b and c were produced in Grapher 10.5. All subsequent layout and design were performed in Illustrator CC 17.1.

