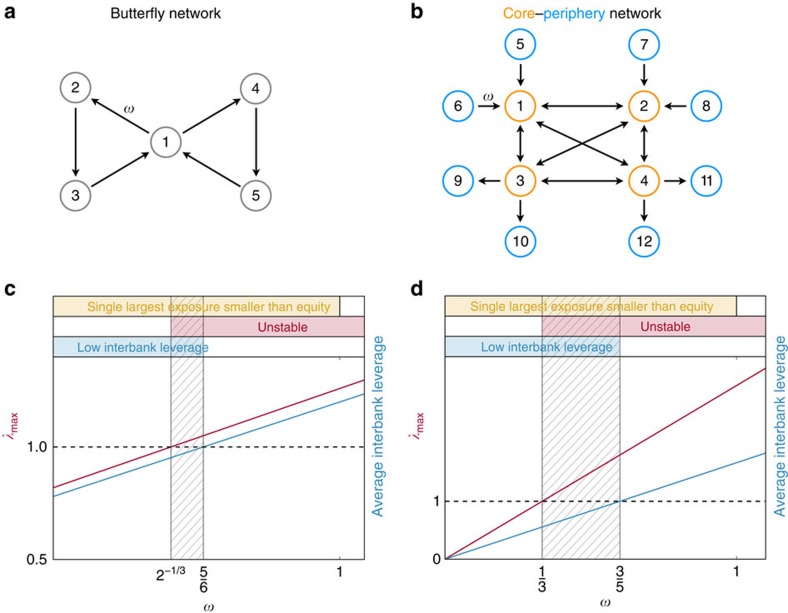
Figure 1. Illustrative stability analysis of two paradigmatic interbank network architectures.
The example in a is a `butterfly' graph, while the example in b has a core-periphery topology: nodes 1, 2, 3 and 4 form a complete core, with the remaining nodes having either only incoming or outgoing edges to the core. For simplicity we set all non-zero elements of the interbank leverage matrix equal to ω, implying that the largest single exposure policy is implemented whenever ω<1. In c and d we plot the average interbank leverage (blue line) and λmax, the largest eigenvalue of the interbank leverage matrix (red line) corresponding to a and b respectively, as functions of the parameter w. The blue region corresponds to an average interbank leverage smaller than one, the yellow region to the largest single exposure smaller than the corresponding equity, while the unstable region is highlighted in red. In both cases there exists a region (shadowed in the figure) in which the following three properties hold: the average interbank leverage is larger than one, the largest single exposure is smaller than the corresponding equity, and yet the network is unstable. Slight modifications of the above examples can also account for tighter constraints on the largest single exposure. For example, even requiring that the largest single exposure is smaller than 15% of the equity (as requested in ref. 46) is not enough to avoid instability in a core-periphery topology with eight nodes in the core.

