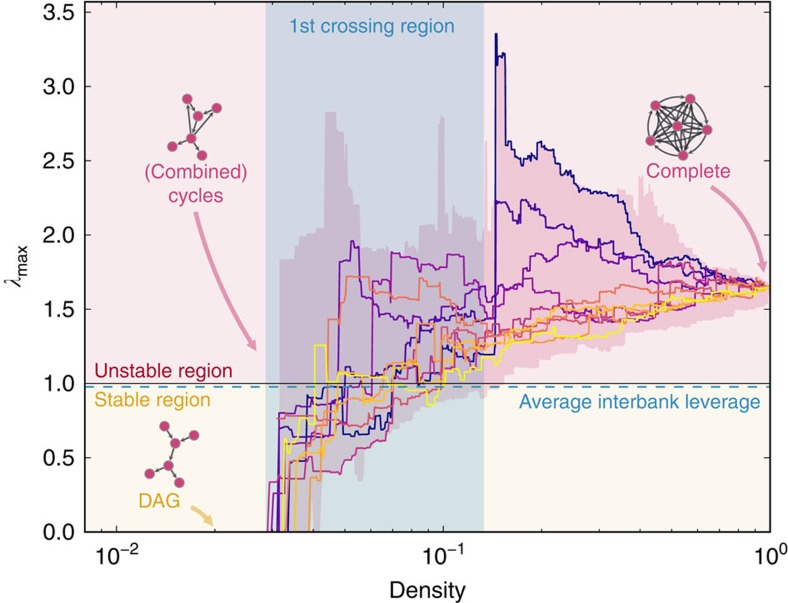
Figure 2. Stability of the network of the top 50 European banks using data from their 2013 balance sheets.
We start from a random DAG, that is, a network with no cycles, which is therefore stable. Interbank exposures are assigned with the RAS algorithm so that, for each bank, the total interbank assets and the total interbank liabilities match the value in the balance sheets. We then progressively create new interbank exposures (that is, we randomly add new edges to the interbank network), until all possible exposures have been created (that is, until the interbank network is a complete graph). Every time a new edge is added, we re-balance the interbank exposures so that, for each bank, the total interbank assets and the total interbank liabilities do not change. As a consequence, the degree of diversification in the banking system gradually increases and all interbank leverages do not change. The stability of the network is constantly monitored by re-computing the largest eigenvalue of the interbank leverage matrix every time a new edge is added. We repeat the whole procedure 100 times. We show the contour of all trajectories and highlight a few of them. The first crossing region (in semi-transparent blue) spans the interval of densities of edges across which the networks become unstable for the first time, meaning that combined unstable cycles appear. We can see that densities as low as 3% are sufficient to reach instability. We also plot the average interbank leverage (dashed blue line) for reference. Balance sheet data from the Bankscope database have been initially used in ref. 13.

