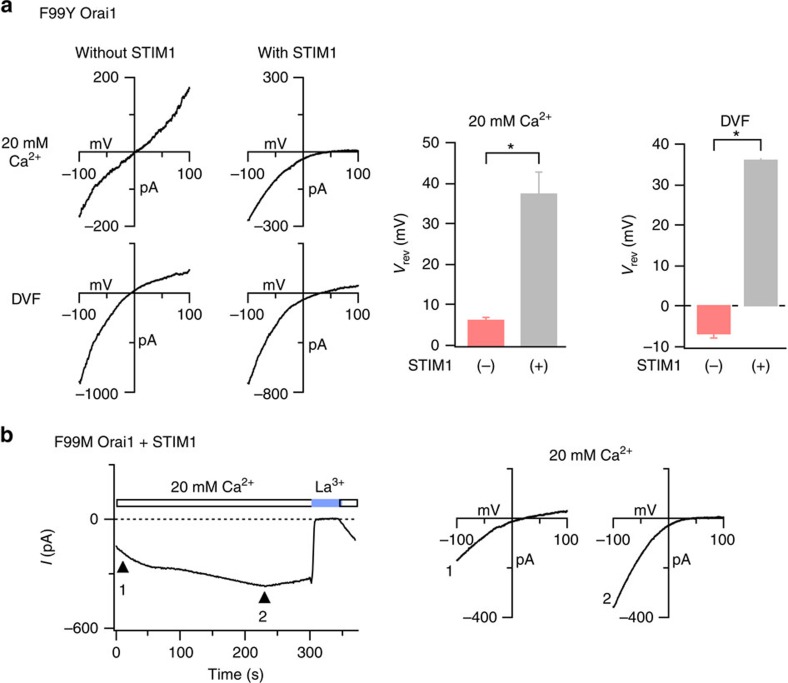
Figure 6. STIM1 regulates the ion selectivity of the constitutively active F99 mutants.
(a) Current–voltage (I–V) relationships of F99Y Orai1 currents in 20 mM [Ca2+]0 and in DVF Ringer's solutions. The bar graphs summarize Vrev in the presence or absence of STIM1. This change in Vrev is consistent with increase in Ca2+ selectivity and decrease in Cs+ permeability21. N=5 cells for each condition. *=P<0.001 (Student's t-test). Values are mean±s.e.m. (b) Time-dependent change in the ion selectivity of the F99M mutant following whole-cell break-in. Intracellular stores were depleted by dialyzing the cell with 8 mM BAPTA. The left graph plots the time-course of the development of ICRAC at -100 mV and the right graphs show the I–V plots at the times indicated by the arrowheads. Time zero represents the moment of whole-cell break-in.

