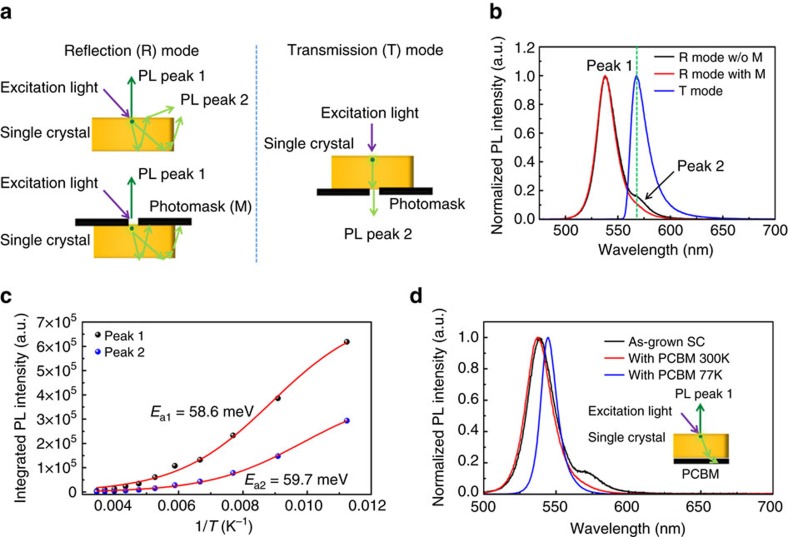
Figure 4. Origin of double peak in the PL spectrum of MAPbBr3 single crystals.
(a) Schematic diagram of the PL measurement modes: reflection mode (left panel) and transmission mode (right panel); (b) Normalized PL spectra of a 1 mm thick MAPbBr3 single crystal (SC) measured under the reflection mode without photomask (black curve) or with photomask (red curve), and under the transmission mode (blue curve); The peak wavelength of the PL measured under the transmission mode matches that of the long wavelength peak (peak 2) measured under the reflection mode without photomask, as marked by the green dashed line; (c) Temperature dependent integrated PL intensity of peaks 1 and 2 shown in b; The red curves are the typical fitting of the data by equation (2) to determine their activation energies (Ea1 and Ea2); (d) Normalized PL spectra of a MAPbBr3 single crystal measured under the reflection mode without photomask (black curve), and with the coating a thick [6,6]-phenyl-C61-butyric acid methyl ester (PCBM) layer on the bottom of the crystal measured at room temperature (red curve) or at 77 K (blue curve); the inset is a schematic diagram of the PL measurement setup.

