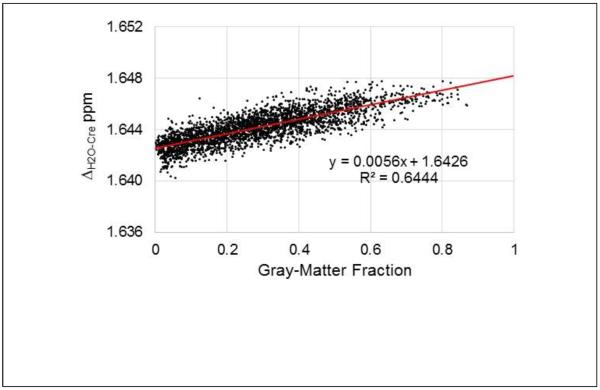
Figure. 4.
Scatterplot of the mean ΔH2O-Cre against the corresponding mean gray-matter fraction at each corresponding voxel, for 27 subjects (Group A). Data was selected for a peripheral brain region encompassing cortical structures, for slices superior to the ventricles. The result of the regression is also shown in red.

