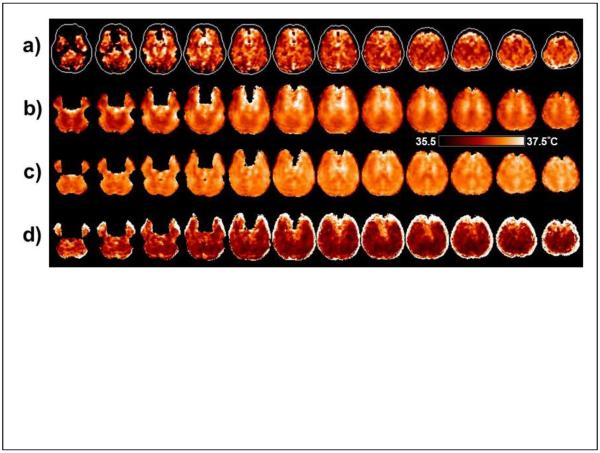
Figure. 6.
Example temperature maps generated using ΔH2O-NAA. (a) Temperature map for an individual subject, displayed for a range of 36.5 to 38.5°C. Slices are displayed at the reconstructed spatial resolution, with 5.6 mm slice interval. (b) The mean value temperature map in MNI space, generated from all subjects in Group A and displayed for a range of 35.5 to 37.5°C. Images are displayed at 6 mm spacing. (c) The corresponding mean value temperature map after including the correction for the susceptibility differences between gray- and white-matter. (d) The standard deviation of the temperature for all subjects in Group A. Within the darker areas of these maps the coefficient of variance ranged from 6% to 12%.

