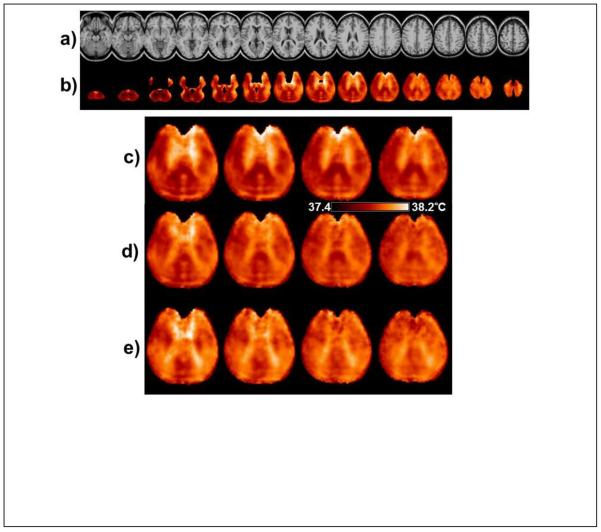
Figure. 7.
(a) The reference MRI used for the spatial normalization. (b) The mean temperature map calculated from ΔH2O-NAA using all subjects. Every third slice (6 mm spacing) is shown from the spatially-normalized image result with a temperature scale range of 1.0°C. In (c), (d) and (e) are shown the central slices at 4 mm spacing using the same color scale of 0.8°C, generated using ΔH2O-NAA, ΔH2O-Cre, and ΔH2O-Cho respectively.

