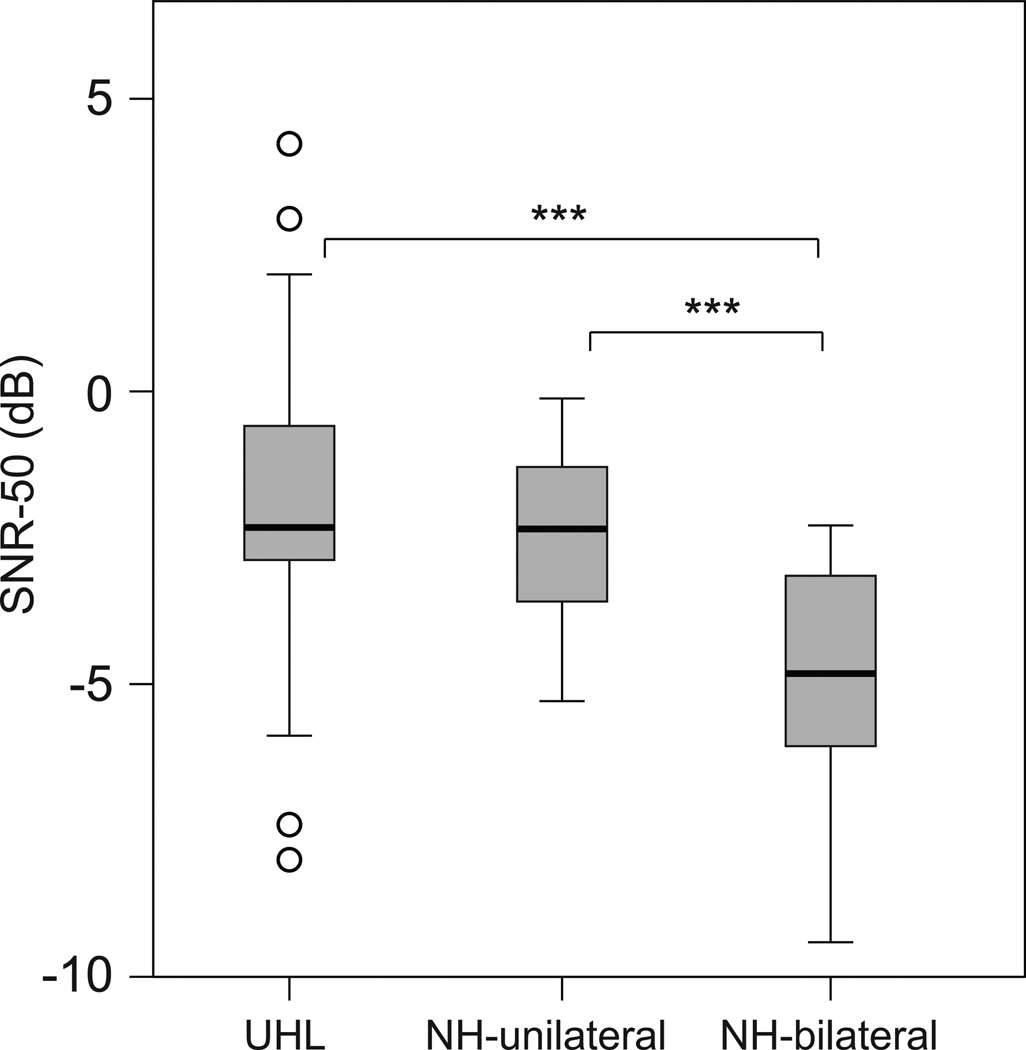
Figure 1.
Box plots indicate the range of performance in the R-Space for each participant group. The box depicts the interquartile range transected by the median; tails represent the 10th to 90th percentiles, and outliers are indicated with open circles. Brackets and asterisks denote significant differences, ***p< 0.001. UHL indicates unilateral hearing loss; NH, normal hearing; SNR-50, speech in noise ratio for 50 percent accuracy.

